

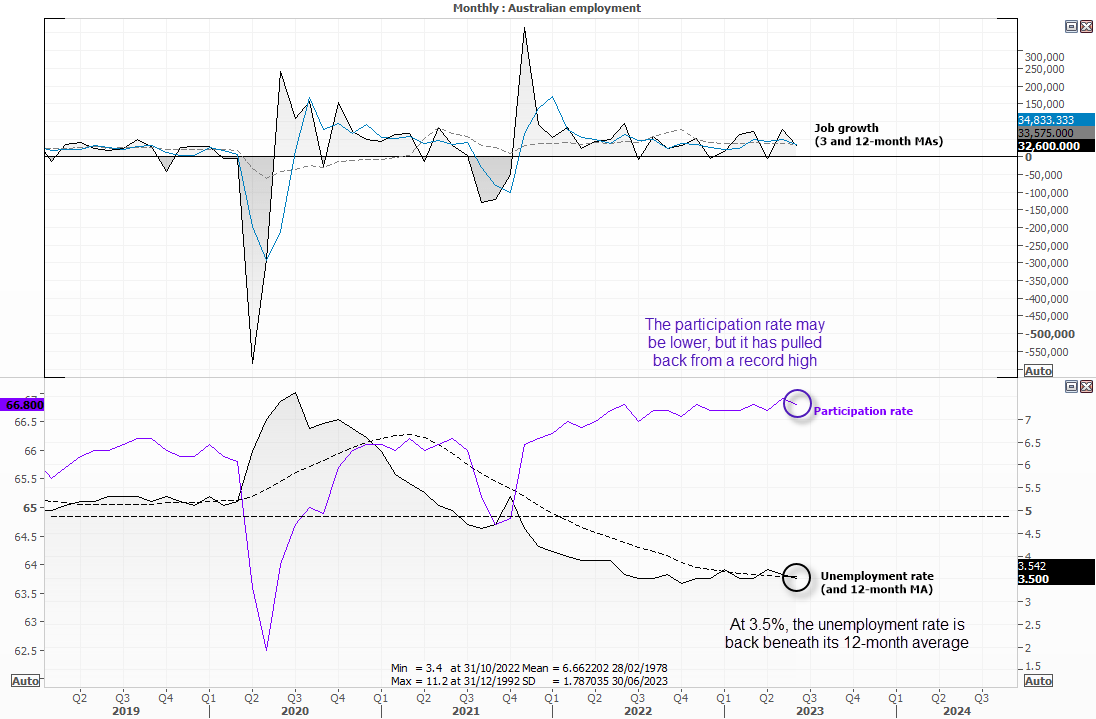
Highlights from Australia’s June employment report
- Unemployment fell to 3.5% and back beneath its 12-month average
- Mau unemployment revised lower to 3.5% from 3.6%
- 32.6k jobs added above 17k previous, May revised higher to 76.6 from 75.9
- 39.3k full-time jobs added, part-time jobs were -6.7k
- Participation rate pulled back from its record high to 66.8% (66.% prior)
- Monthly hours worked rose 0.5% (higher productivity)
Job growth beat expectations and unemployment back to 3.5% and below its 12-month average. So we’ll turn a blind eye to the lower participation rate, given it has pulled back from a record high.
Ultimately, it’s another strong set of employment figures which keeps the pressure on a data-dependant RBA to potentially hike rates in August. And it could take quite a set of lowballed inflation figures next week for that pressure to be removed. Moreover, it’s the quarterly inflation report which carries more weight for the RBA’s decision.
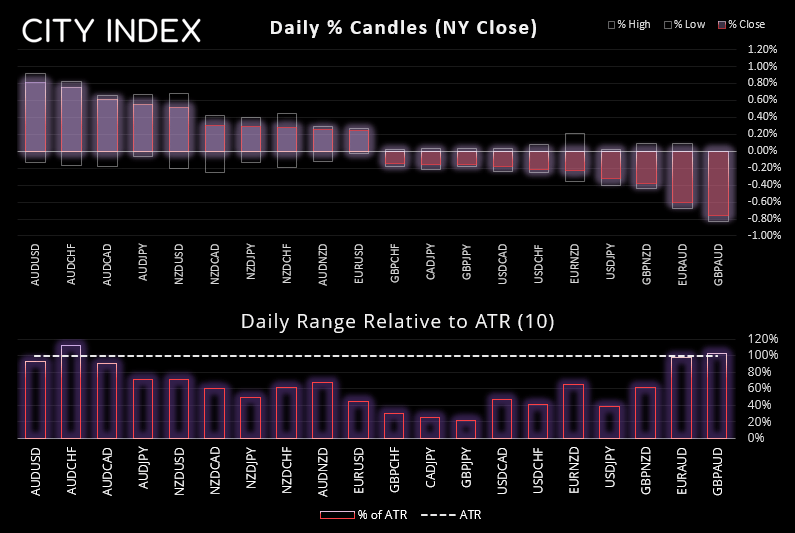
AUD pairs spike higher, ASX 200 pauses at resistance
The Australian dollar has spiked higher across the board after the economy delivered another rate-hike defying report. AUD is currently the strongest FX major in today’s session, with AUD/CHF and GBP/AUD exceeding their 10-day ATR’s.
AUD/NZD has regained its footing above 1.0800 and now trades backs above its 50-day EMA, and the bias remains for the cross to move towards 1.0900 – a break above which brings 1.10 into focus. A key driver for this bias is for investors to slowly realise that the RBA may need to hike at least once or two more times whilst the RBNZ remain in pause mode, which will see the RBNZ-RBA interest rate differential diminish and support a higher AUD/NZD.
The ASX 200 has been knocked form its perch after its earlier attempt to tap 7400. And with it holding beneath the April and June highs, I suspect some bulls will be questioning their long exposure at these levels. A pullback could be due.
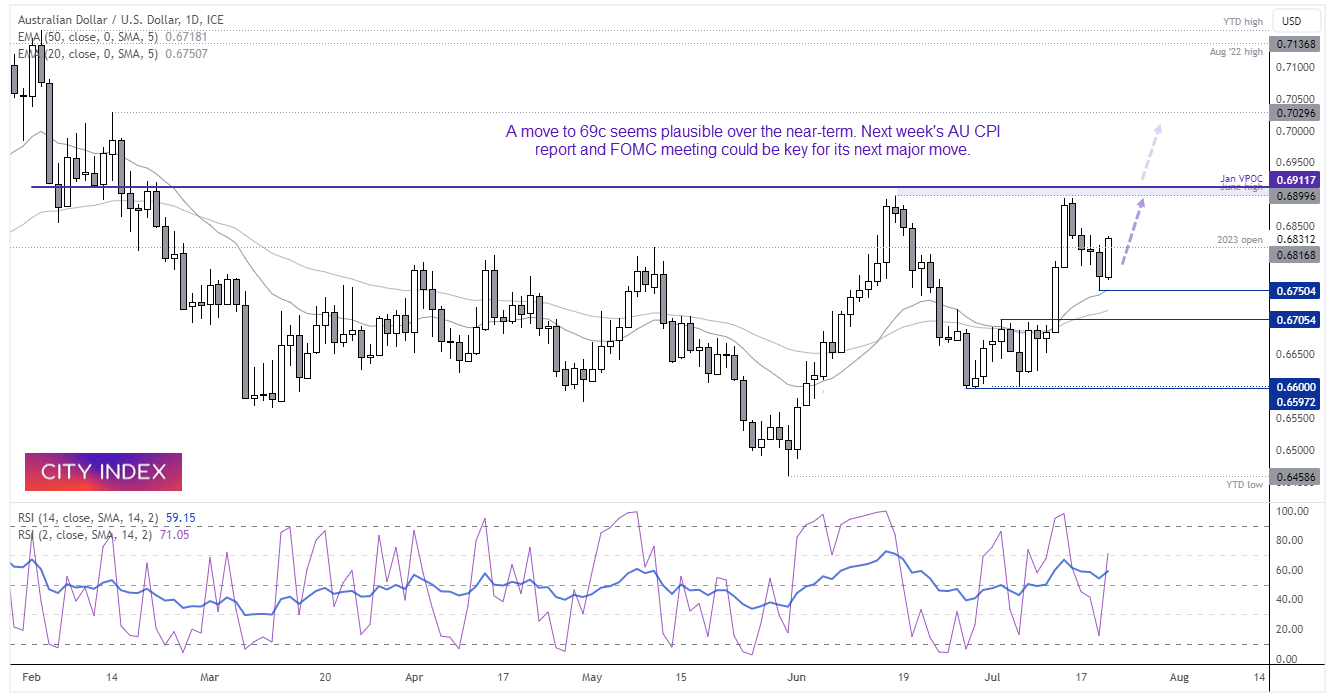
AUD/USD daily chart:
A 4-day pullback on AUD/USD found support just above the 50-day EMA and momentum has now realigned with its breakout of 67c last week. A daily close around current prices would provide a bullish engulfing day above the 2023 open price, which adds to the potential that an important swing low has been seen at 0.6750. From here, I suspect a move to 69c is now on the cards. Bulls could seek bullish setups within today’s range or seek bullish continuation patterns on intraday charts to hopefully improve the reward ratio.
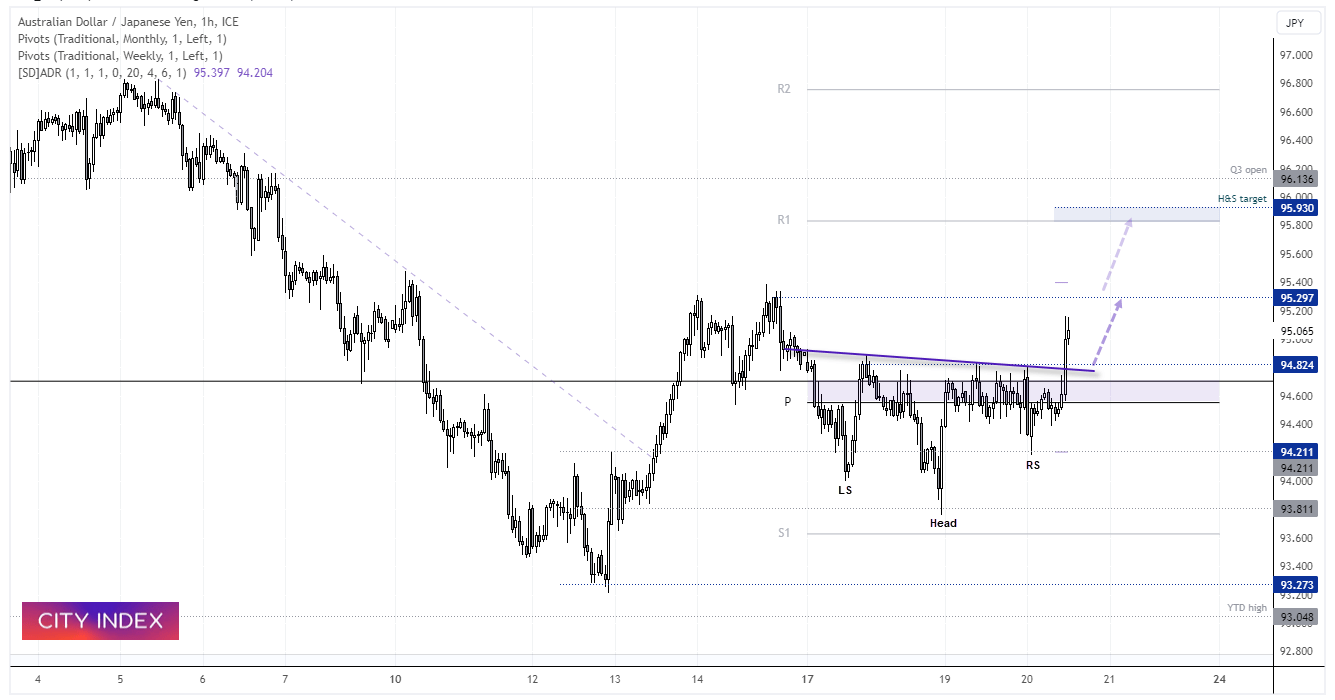
AUD/JPY 1-hour chart
We outlined our bullish bias on AUD/JPY in today’s Asian Open report, and we can see how today’s employment report kicked it into action. We’ve seen a clean breakout of an inverted head and shoulders pattern which projects an approximate target just below 96.0. But as prices are near the 96 highs, we’d prefer to see prices pull back towards the neckline to increase the potential reward to risk ratio. And that leaves the highs around 93 and the weekly R1 pivot in focus for potential bullish targets.
-- Written by Matt Simpson
Follow Matt on Twitter @cLeverEdge
How to trade with City Index
You can trade with City Index by following these four easy steps:
-
Open an account, or log in if you’re already a customer
• Open an account in the UK
• Open an account in Australia
• Open an account in Singapore
- Search for the market you want to trade in our award-winning platform
- Choose your position and size, and your stop and limit levels
- Place the trade
Latest market news
Yesterday 01:32 PM
Yesterday 09:35 AM
Yesterday 07:23 AM
Yesterday 04:48 AM
Yesterday 12:17 AM
July 25, 2024 10:39 PM
Latest Trade Ideas articles

Yesterday 09:35 AM

Yesterday 12:17 AM

July 25, 2024 10:39 PM

July 25, 2024 05:30 PM