

Alibaba rose around 6% during Asian trade after announcing its intention to apply for a primary listing in Hong Kong.
Whilst Alibaba (BABA) is already available to trade on the Hong Kong Stock Exchange (HKEX) under the ticker 9988, it is only a secondary market. The company now intends to apply for a primary listing in Hong Kong to broaden and diversify its investor base, particularly in China and across Asia. Recent rule changes by HKEX allow Chinese companies to apply for dual listing following threats from the US to delist select Chinese companies.
Alibaba will now be available on ‘Stock Connect’, a cross-boundary investment channel which allows investors from both the Shanghai and Hong Kong Stock exchanges to trade the shares on either exchange. Ultimately this means greater opportunity for investors to get involved in the company.
Alibaba daily chart (9988 – Honk Kong listed):
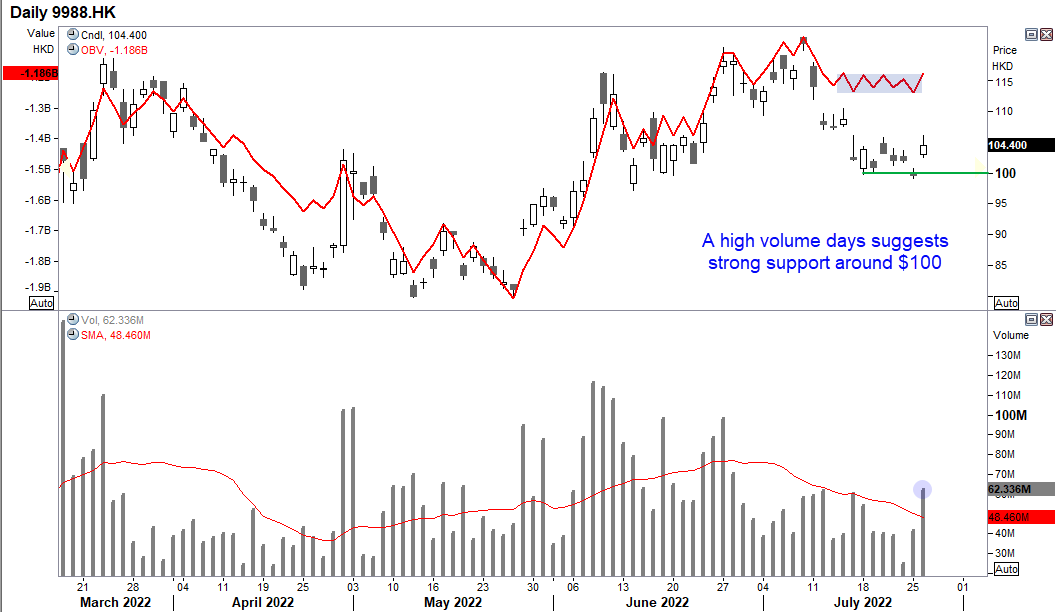
We can see on the daily chart that Alibaba posted a strong rally following the news. It was seen on high volume which shows fresh buyers stepping into the market, and reinforced $100 as a strong level of support. With that said, a break beneath $100 could mark the beginning of a stronger move lower.
Note how OBV (on balance volume) remains elevated relative to price action, which suggests buyers have the upper hand. However, it remains within a tight range so any gains from here would need to be accompanied with a breakout on the OBV to confirm it.
Alibaba daily chart (BABA – US listed):
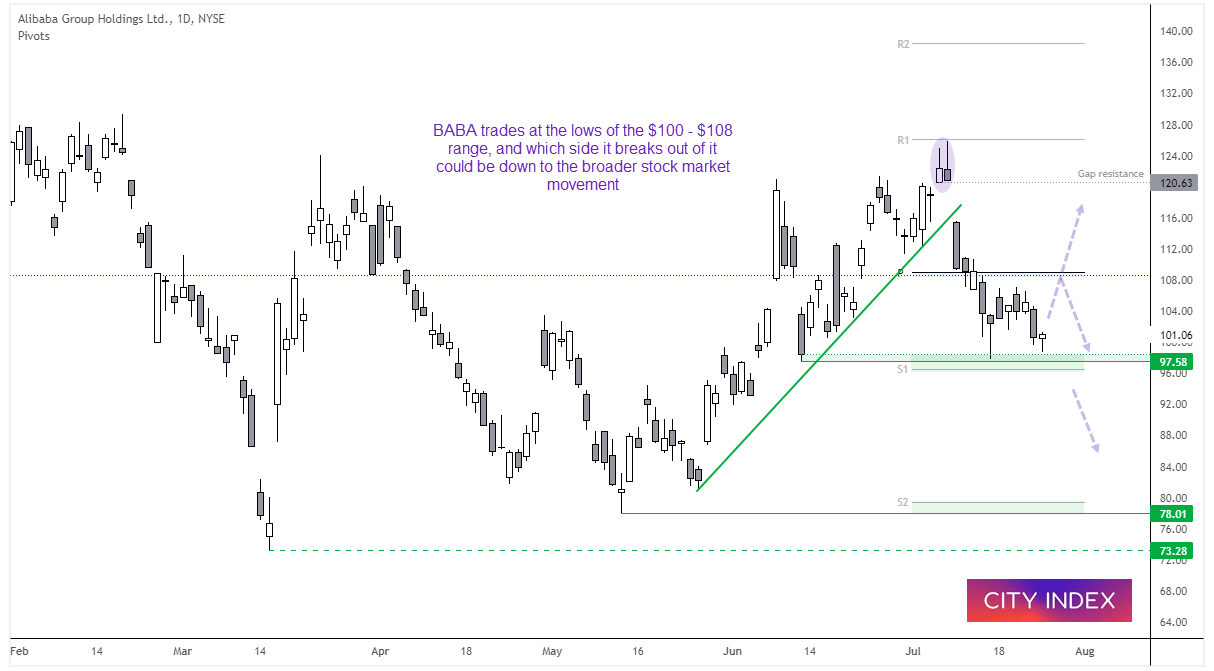
Price action on Alibaba’s daily chart shows it has effectively ranged between 73 – 126 since March. At the beginning of July two bearish hammers formed and it gapped lower, to mark a prominent top. It’s therefore possible we could see the stock break below 98, although today’s news is likely to see it rise within the 100 – 108 range. Therefore, we have a bullish bias within the 100 – 108 range, but equally open to an upside break of 108 or bearish break below 98 further out. And we may need to rely on the direction of the broader market to find out which side of this small range it breaks out of.
Hang Seng Daily Chart:
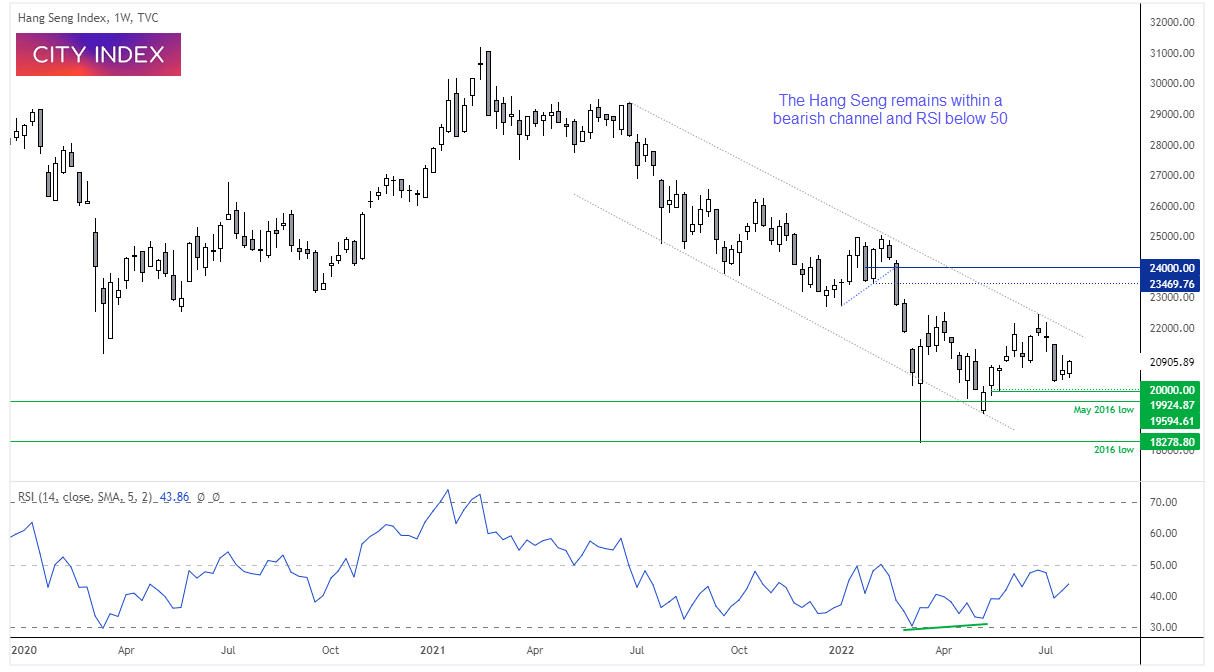
The Hang Seng remains in a bearish channel on the weekly chart, although there are some signs that it wants to change its trend; a strong bullish hammer formed in March, a higher low formed in May and it is trying to form a higher low now. A bullish divergence also formed on the RSI. However, the RSI remains below 50 which shows weak momentum overall, and the large bearish candle two weeks ago suggests bears retain in control, in line with the downtrend. An inside week shows compression is underway, although if the market can hold above 20k then perhaps it can rise to retest the upper trendline and paint a bullish bias on the daily chart over the near-term.
How to trade with City Index
You can easily trade with City Index by using these four easy steps:
-
Open an account, or log in if you’re already a customer
• Open an account in the UK
• Open an account in Australia
• Open an account in Singapore
- Search for the company you want to trade in our award-winning platform
- Choose your position and size, and your stop and limit levels
- Place the trade
Latest market news
Yesterday 01:32 PM
Yesterday 09:35 AM
Yesterday 07:23 AM
Yesterday 04:48 AM
Yesterday 12:17 AM
July 25, 2024 10:39 PM
Latest Trade Ideas articles

Yesterday 09:35 AM

Yesterday 12:17 AM

July 25, 2024 10:39 PM

July 25, 2024 05:30 PM