March 24, 2021 4:47 PM
7-year auction Preview: Will it be as bad as February’s auction?
What: US 7-year Treasury Auction
When: Thursday, March 25th, 2021 1:00pm
Why is it important: Recall the 7-year Treasury note auction on February 25th. It was bad. The bid-to-cover was 2.045, which is the lowest on record. In addition, indirect bidders fell to 38.06%. Indirect bidders are often used as a proxy to determine international demand. At only 38%, this left direct bidders to take down the balance of the supply, which they probably didn’t want to do.
Why it matters: Although yields had been already rising, the poor 7-year auction resulted in an aggressive sell-off in bonds, which accelerated the move higher in yields and the US Dollar.
Like 10-year yields, 7-year yields had been slowly rising since the fall. However, in February, yields began to move higher at a faster pace. Notice on the daily timeframe that on February 25th, as a result of the auction, the 7-year yield moved from 1.003 to 1.236! Bonds continued lower and yields rose to the 127.2% Fibonacci extension from the March 19th, 2020 pandemic highs to the August 4th lows, near 1.405. Yields have been forming a rising wedge and on Wednesday, broke below the wedge. The question now is: Will a bad auction cause yields to spike higher, just as in February, towards the recent highs near 1.40? The next resistance above there is the 161.8% Fibonacci extension near 1.689! There is also horizontal resistance near both Fibonacci extensions!
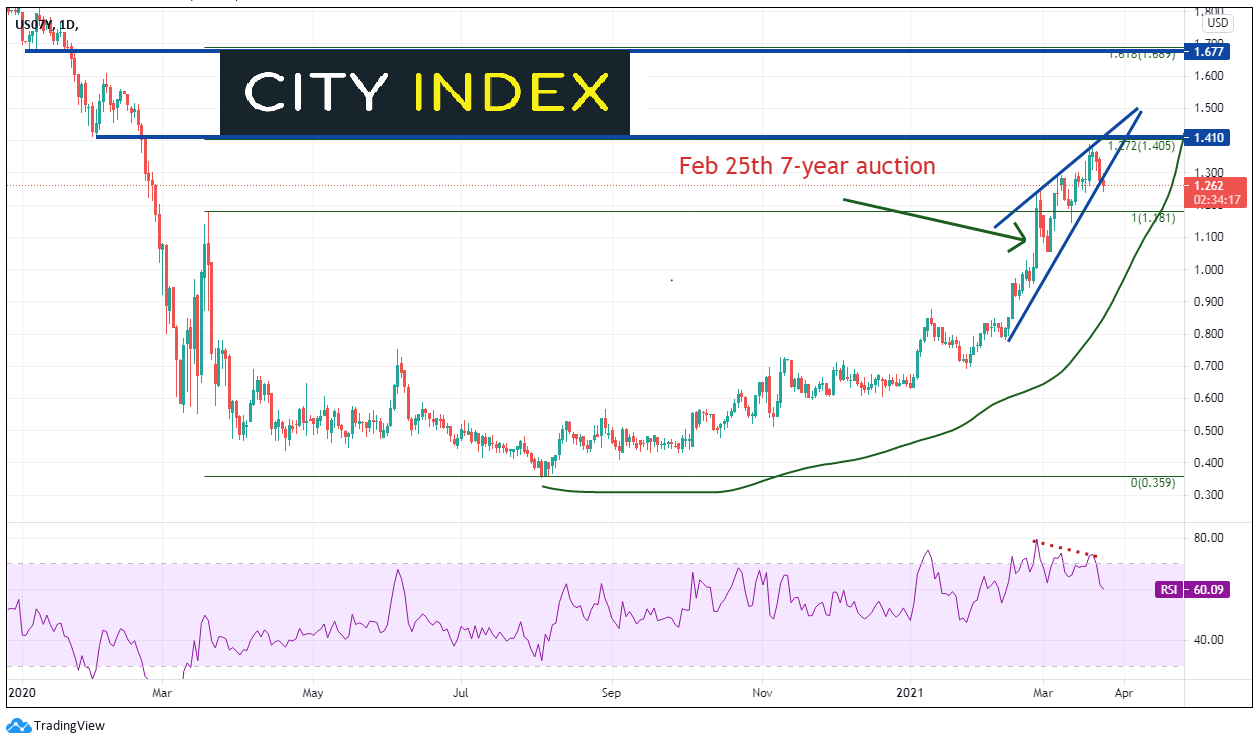
Source: Tradingview, City Index
Yields weren’t the only ones affected by the poor auction. On February 25th, the US Dollar put in a hammer candlestick formation on a daily timeframe and hasn’t looed back since. Notice that the DXY moved to the 61.8% Fibonacci retracement level from the November 4th, 2020 highs to the January 6th lows, near 92.33. The US Dollar Index consolidated in a flag formation and broke higher, out of the flag, this week. The target for a flag patten is the length of the flagpole added to the breakout point of the flag, which in this case is near 94.07. If the DXY reaches its target, it will be just pips away from the target of the longer term descending wedge, at 92.28. (The target for the breakout of a descending wedge is a 100% retracement of the wedge). Will a bad auction cause the DXY to spike higher, just as in February, towards the flag target?
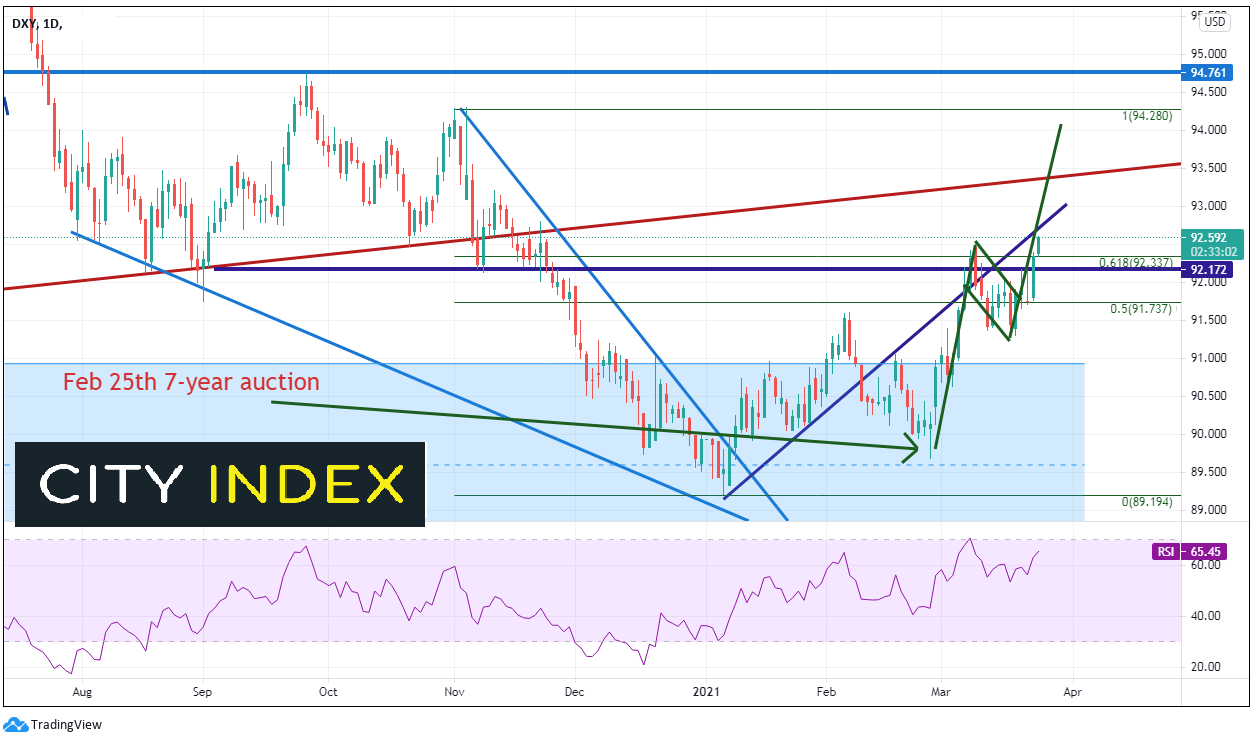
Source: Tradingview, City Index
So, this won’t be “just another 7-year Treasury auction”. Markets will be watching the bid-to-cover and the number of indirect bidders for results of the auction. If the demand is poor, as it was in February, yields and the DXY could move significantly higher!
Learn more about forex trading opportunities.
Latest market news
Yesterday 01:32 PM
Yesterday 09:35 AM
Yesterday 07:23 AM
Yesterday 04:48 AM
Yesterday 12:17 AM
July 25, 2024 10:39 PM
Latest Bonds articles

July 1, 2024 11:04 PM

May 30, 2024 06:11 AM


May 3, 2024 01:00 AM