


DJIA, S&P 500, and Nasdaq 100 Key Points
- Traders have priced out any prospect of another Fed rate hike and are now looking ahead to potential interest rate cuts in the first half of 2024.
- Major US indices are all testing key resistance levels and could pull back over the next couple days.
- That said, the strong bullish momentum leaves the bias firmly in favor of the buyers for a potential move to new year-to-date highs next.
US Index Overview
As it turns out, the only thing that was looking forward to Halloween more than my daughter was the stock market.
The final week of October marked a major bottom for all the major US stock market indices, with the bullish thrust gaining momentum amidst signs that both inflation (CPI, PPI) and the labor market (NFP, initial jobless claims) are moderating.
Accordingly, traders have effectively priced out any additional interest rate hikes from the Federal Reserve, and traders, being the forward-looking bunch that they are, have already started to look forward to interest rate cuts from the US central bank. As the chart below shows, the average “pause” between the last Fed rate hike and the first interest rate cut has historically been eight months, though in some cases, it has been as a long as 18 months:
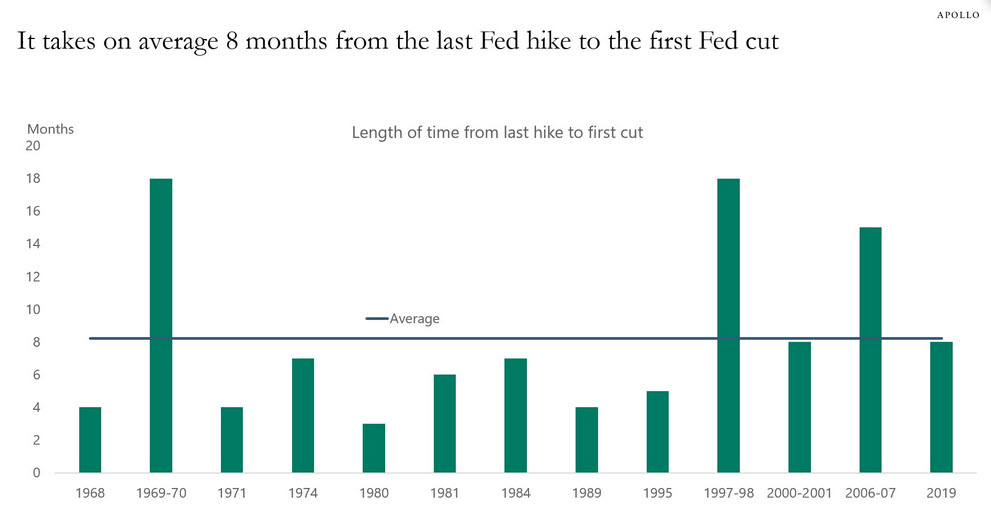
Source: Apollo
Assuming the Fed’s last interest rate increase was the 25bps hike in August, that would put a first rate cut around the April-May timeframe, assuming the central bank follows the historical average, although Jerome Powell and Company have thus far pointed to a longer pause at peak rates being appropriate for this cycle. For what its worth, traders are pricing in a nearly 70% chance of a first interest rate cut by the Fed’s May 1 meeting.
In any event, the high likelihood that we’ve seen the last interest rate hike for this cycle has been enough to boost major US indices by 6-10% so far this month.
Dow Jones Technical Analysis – DJIA Daily Chart
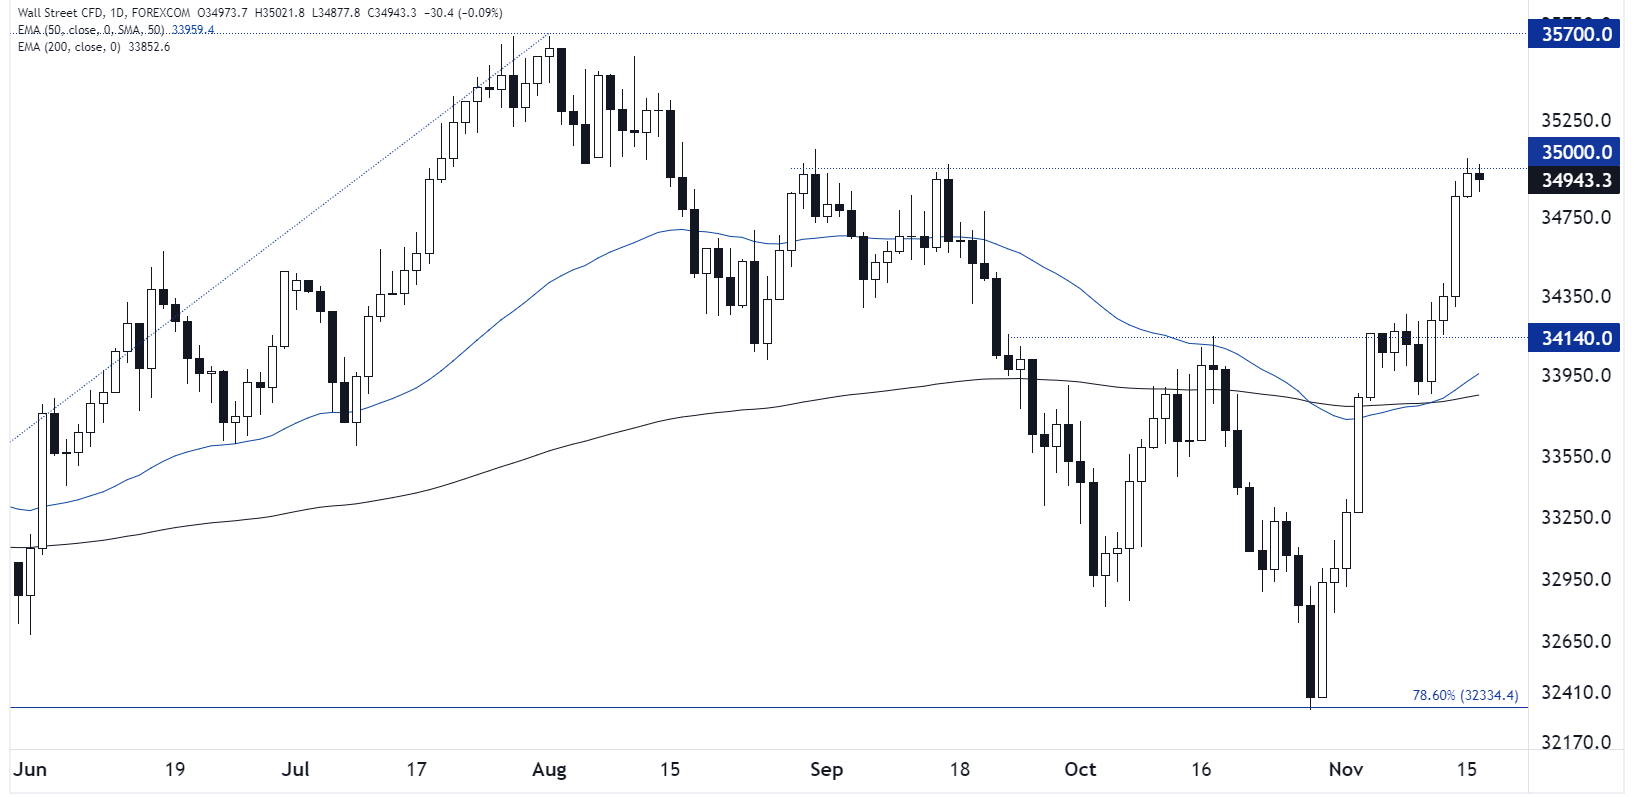
Source: TradingView, StoneX
Looking at the oldest US index first, the Dow Jones Industrial Average has surged up to test its 3-month high near 35,000. After such a strong move in a short period, a pullback from this resistance level wouldn’t be surprising, but the technical bias will remain bullish as long as the index holds above previous-resistance-turned-support and its 50-day EMA near 34,100.
S&P 500 Technical Analysis – SPX Daily Chart
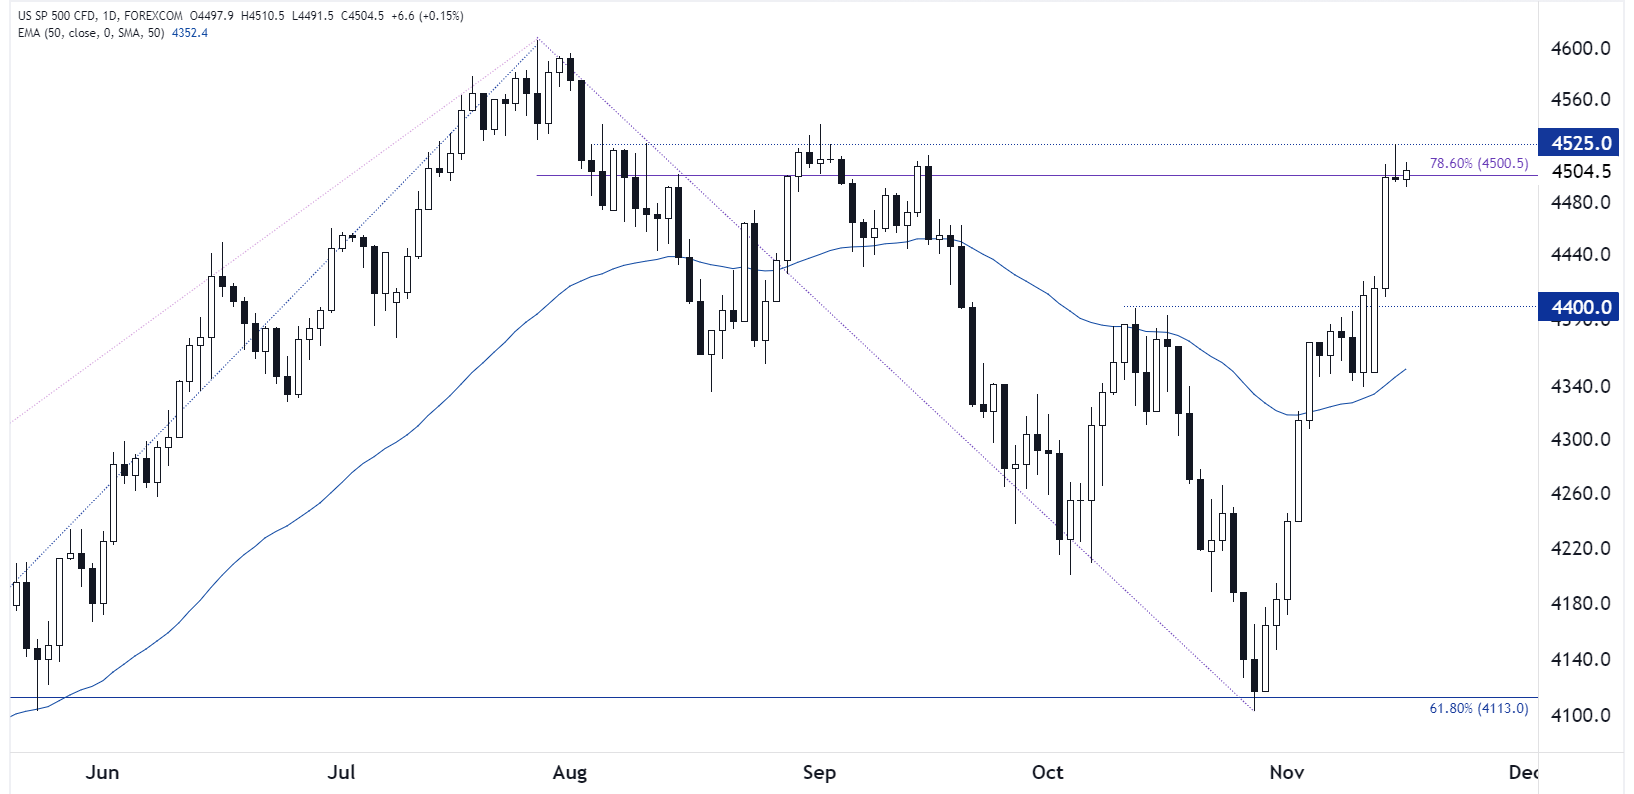
Source: TradingView, StoneX
For its part, the broader S&P 500 looks very similar to the Dow. As the chart above shows, SPX is currently stalled within the 4500-4525 zone that marks the confluence of the August and September highs and the 78.6% Fibonacci retracement of the July-October drop. As with the DJIA, a short-term pullback appears likely, but buyers are likely to step in ahead of 4400, and a confirmed breakout above 4525 would bring the year-to-date highs near 4600 into view.
Nasdaq 100 Technical Analysis – NDX Daily Chart
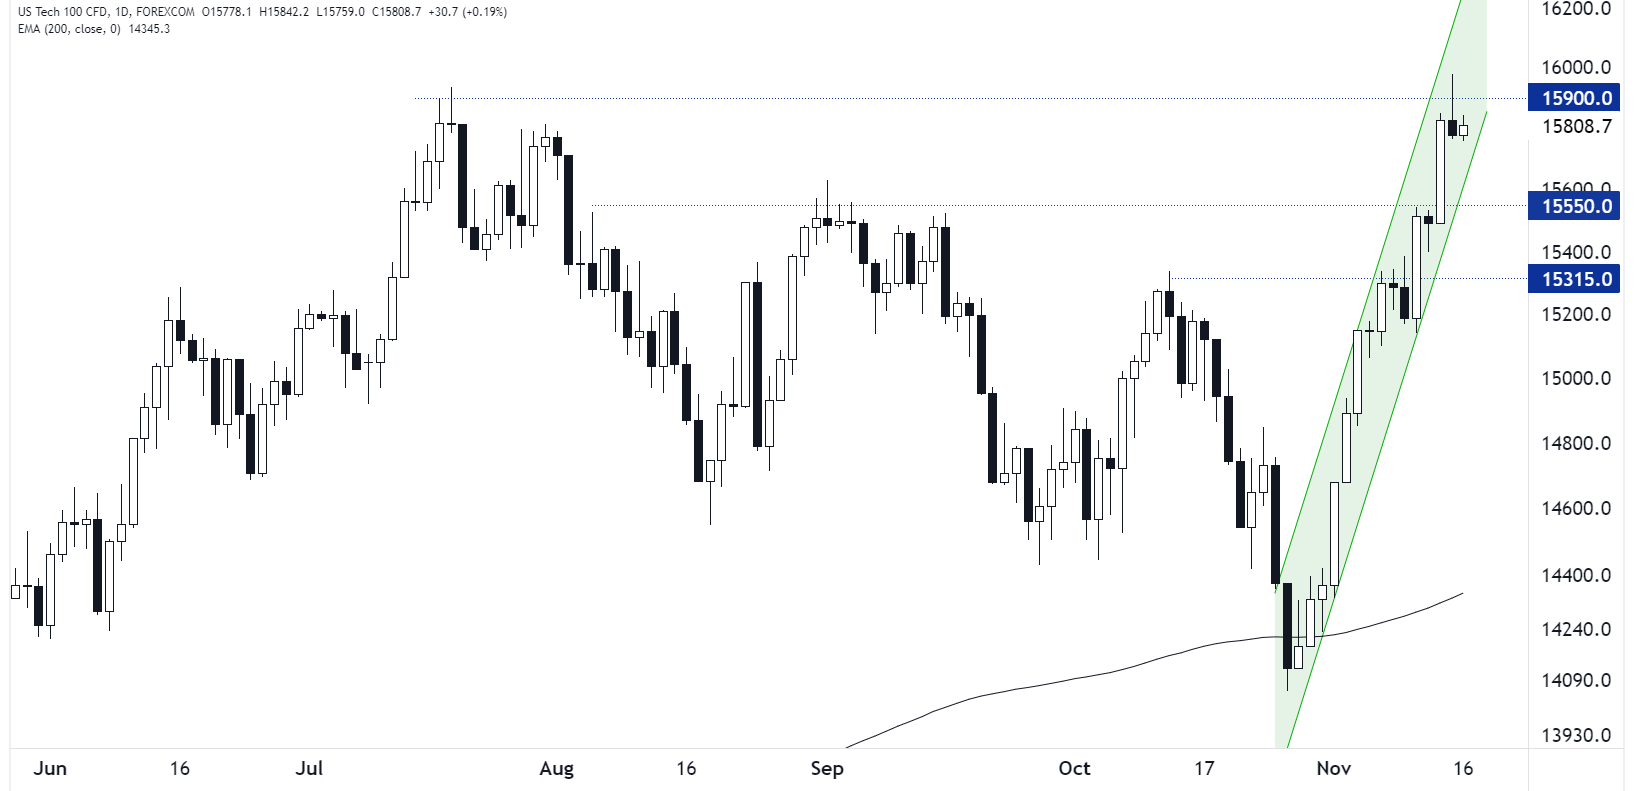
Source: TradingView, StoneX
Last but not least, the tech-heavy Nasdaq 100 has seen the strongest rally of all so far this month, gaining over 10% since Halloween night. NDX has broken above its equivalent resistance level near 15,550 and is testing its 2023 high at 15,900 as we go to press. At the risk of sounding like a broken record, bulls may want to wait for a short-term dip before buying, but a clean break through 15,900 resistance would open the door for another leg up from here.
Sometimes, the strongest market rallies never give patient bulls an opportunity to join them!
-- Written by Matt Weller, Global Head of Research
Follow Matt on Twitter: @MWellerFX
Latest market news
Yesterday 01:32 PM
Yesterday 09:35 AM
Yesterday 07:23 AM
Yesterday 04:48 AM
Yesterday 12:17 AM
July 25, 2024 10:39 PM
Latest SPX 500 articles

July 25, 2024 01:30 PM

July 23, 2024 11:45 AM

July 22, 2024 02:12 PM

July 18, 2024 11:35 AM