


Market Summary:
A softer ISM services report slammed the US dollar broadly lower and saw yields hand back earlier gains. The headline figure expanded at its slowest pace in three months, new orders were slower whilst the employment index contracted again. Yet the standout figures is the 'prices paid' index, which expanded at its slowest pace since the pandemic and notched up its second month in a row that the index has shed over 5 points.
Clearly, this excited doves as the US dollar index its worst day in three months, falling for a second day after meeting resistance around 105. It is also a good time to remember that April is generally the second worst month of the year.
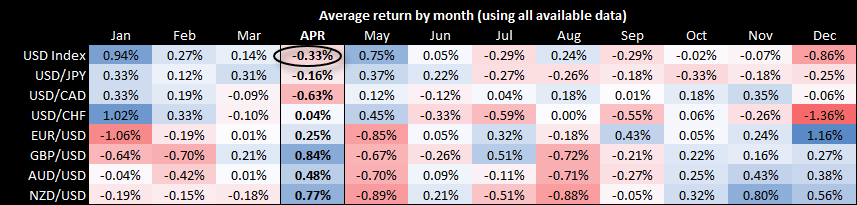
As the matrix shows, the US dollar index has averaged a negative return of -0.33%. It median return is -0.79% which suggest a few bullish outliers have propped the average up, and the win rate is 37.2% (which means it has closed lower 62.8% over the past 43 years).
- Whilst Fed fund futures lowered the odds of a June cut, they’re still pricing one in with a 58.3% probability
- Fed members continued to push back against imminent rates cuts, with Jerome Powell on Wednesday saying that that they need greater “confidence that inflation is moving substantially down” before rates are cut.
- Usually, that could have supported the US dollar as it plays nicely into the ‘higher for longer’ narrative, yet traders are placing greater emphasis on economic data over what the Fed says
- Gold reached yet another new record high, stopping just shy of the $2300 handle
- WTI crude settled above $85 for the first time this year, although it also closed the day flat with a Rikshaw man doji outside the upper Keltner band to warn of near-term trend exhaustion
- The S&P 500 and Nasdaq printed modest gains on Wednesday whilst the Down Jones closed flat with a small-ranged Doji, which provides little in the way of clues for its next move ahead Friday’s NFP report
US dollar index seasonality (daily):
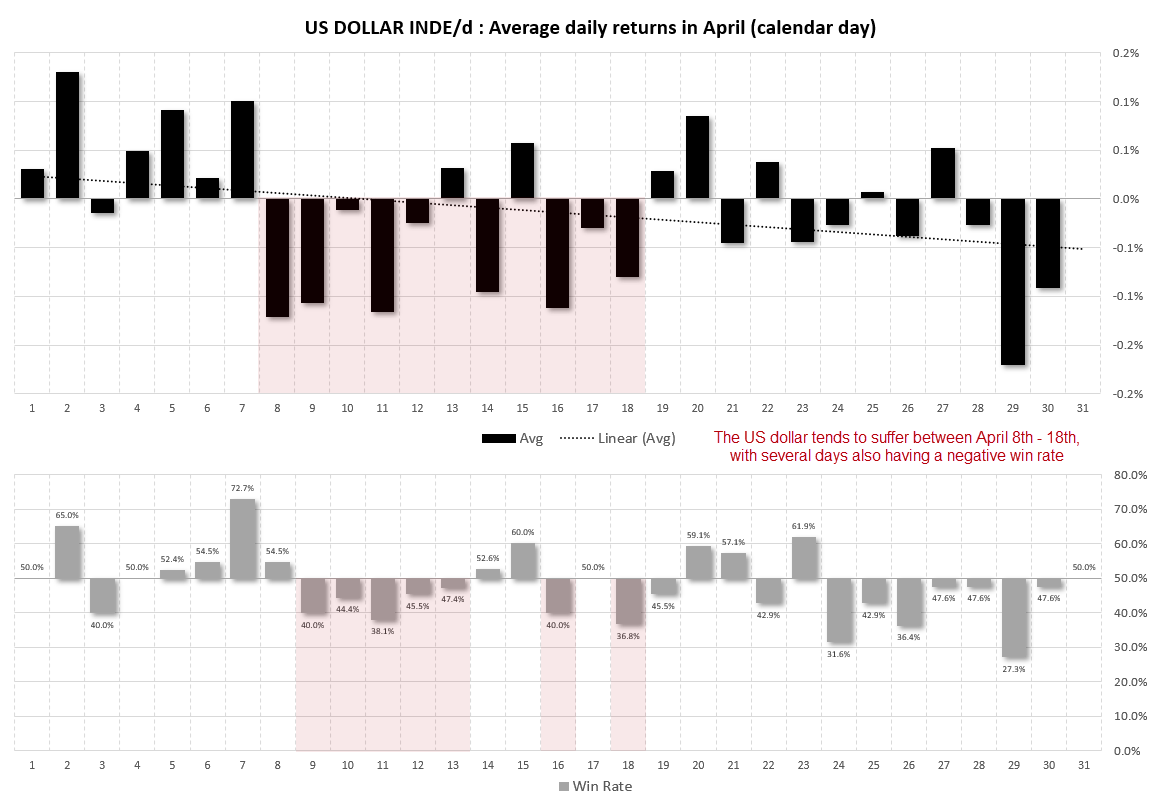
We’ve established that April tends to the second most bearish month of the year, so we’ll take a look at average daily returns for the month. Whilst far from perfect, the US dollar index tends to generate negative returns between April 8th – 18th, and most of those days are accompanied with negative win rates. Incidentally, this also ties into the bullish pattern identified on GBP/USD after the beginning of the new financial year. So if GBP/USD and the US dollar index are to follow their intramonth seasonality, traders could be on guard for GBP/USD gains or DXY weakness beginning next week.
US dollar index technical analysis:
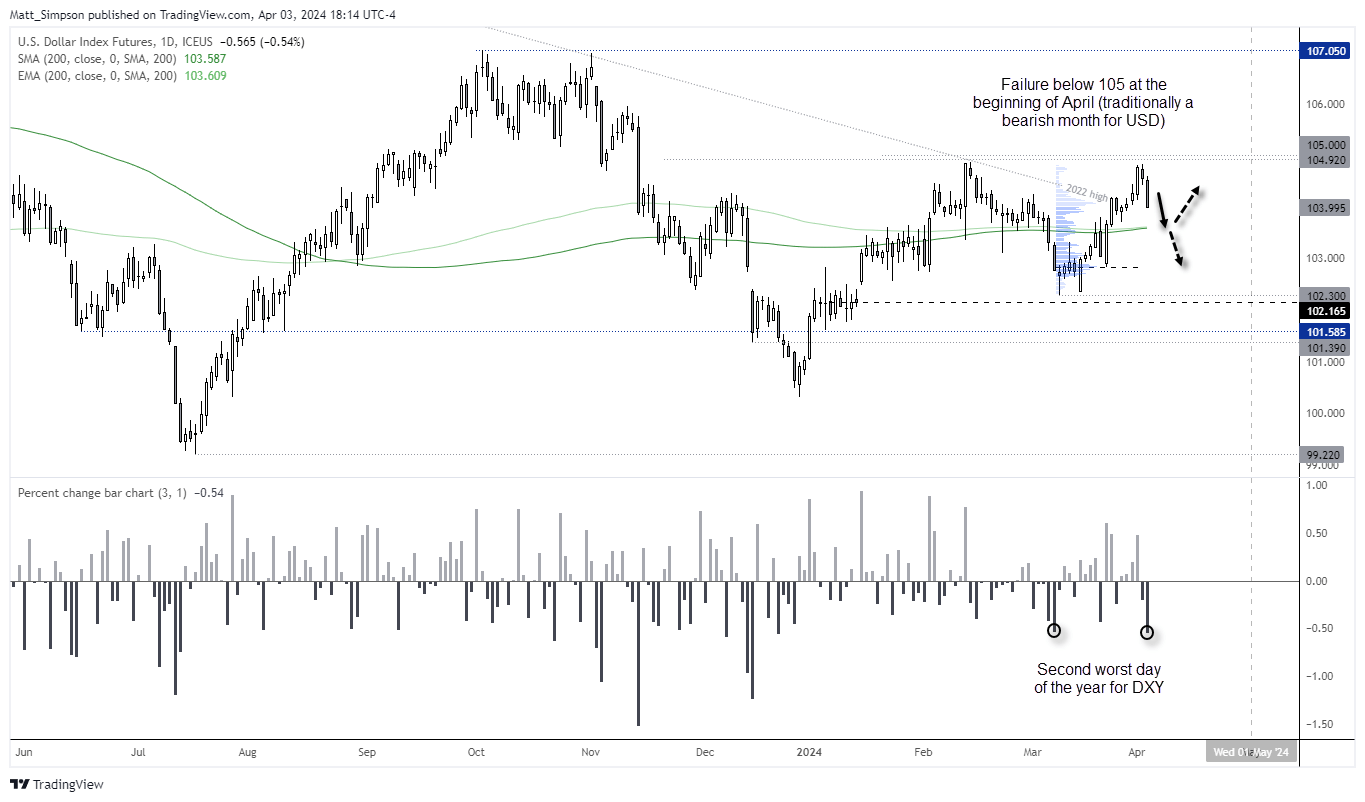
The US dollar index fell for a second day and tallied up its second worst day of the year. Its failure below 105 has left a double top, and further downside potential is on the horizon. The 200-day average and EMA make a likely support level around 103.60, but it could at least make a near-term target for bears. Whether it can break back below these key averages are likely down to whether the Fed begin signalling cuts or if incoming data continues to convince the Fed will be forced to cut anyway. And that makes tomorrow’s NFP report the more important.

Events in focus (AEDT):
- Public holiday in China, Hong Kong
- RBA assistant governor Jones speaks
- 10:50 – Japan foreigner stock/bond purchases
- 11:00 – New Zealand commodity price index (ANZ)
- 11:30 – Australian building approvals
- 17:30 – Swiss inflation
- 18:55 – German PMIs (services, composite)
- 19:00 – Eurozone PMIs (services, composite)
- 19:30 – UK PMIs (services, composite)
- 20:00 – Eurozone PPI
- 22:30 – US job cuts (challenger)
- 23:30 – US jobless claims
- 23:30 – Canadian trade balance
AUD/USD technical analysis:
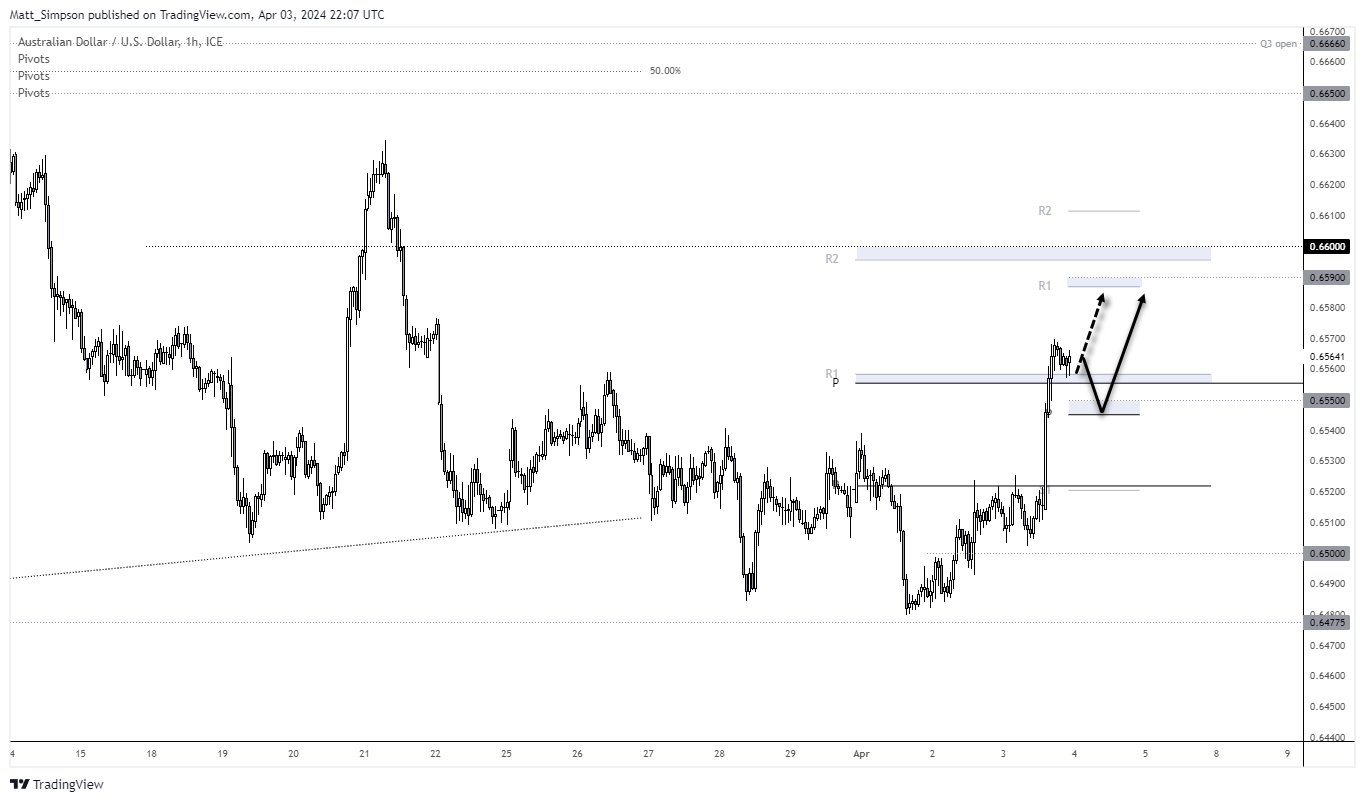
I can’t say it didn’t come without warning, but AUD/USD has rallied after a false break of 65c. Two weeks ago I identified a potential head and shoulders top on the AUD/USD daily chart, yet decided to scrap it after it spent too long messing around the neckline. Simply put, a breakout on such reversal patterns should be hard and fast, hence the call for a false break and rally above 65c.
The 1-hour chart shows a clear burst of bullish momentum. Prices have retraced to the monthly pivot point and weekly R1, so perhaps the swing low has already formed and the next stop is around the daily R1 / 0.6590 handle. Should price instead move lower during the Asian session, the bias is to seek dips around the daily pivot / 0.6550.
View the full economic calendar
-- Written by Matt Simpson
Follow Matt on Twitter @cLeverEdge
How to trade with City Index
You can trade with City Index by following these four easy steps:
-
Open an account, or log in if you’re already a customer
• Open an account in the UK
• Open an account in Australia
• Open an account in Singapore
- Search for the market you want to trade in our award-winning platform
- Choose your position and size, and your stop and limit levels
- Place the trade
Latest market news
Today 01:39 PM
Today 11:05 AM
Today 10:46 AM
Latest Asian Open articles

April 23, 2024 11:09 PM

April 22, 2024 10:48 PM

April 18, 2024 11:27 PM

April 17, 2024 11:16 PM