


- S&P 500 analysis: Can the stock market rally continue?
- Chinese PMIs, German CPI and US non-farm payrolls among week’s highlights
- S&P 500 technical analysis shows strong bullish trend
After rising 11% in the fourth quarter of last year, the S&P added another 10% in Q1, in what has been one of the biggest ever rallies. Following a robust quarter for US markets, we may see at least one last hurrah in the first week of the second quarter, even as concerns about overstretched valuations linger. After all, the bulls remain in full control. A preference for dip-buying strategies makes more sense until the charts indicate otherwise. In the week ahead, we also have some key macro events to look forward to. But at the time of writing on Thursday, Friday’s macro events had the potential to create a bit of volatility when markets re-open after Good Friday holiday on Monday.
S&P 500 analysis: Can the stock market rally continue?
Well, you can't really argue with it, can you? The trend is strong at the moment, and there aren’t any major bearish factors to throw a spanner in the works. But there's the long weekend to consider, and there are a couple of big events on Friday that may give asset prices a bit of a shake, when futures open on Sunday evening.
The big macro data is core PCE index, which is the Fed's favourite way of measuring inflation. Trouble is, the stock markets are having a day off for Good Friday, so any surprises in the PCE data might hit the market when Asia kicks off in the week ahead. Plus, Jerome Powell is due to have a chinwag on Friday too, which might shed some light on what the Fed is thinking about interest rates.
With the stock market shut on Good Friday, investors need to keep an eye out for the long-weekend risk today, especially with the chance of inflation data surprising to the upside. Additionally, expect to see some volatility related to portfolio rebalancing following what has been another strong quarter for the markets.
Stocks have been on a blinder for the last three months, thanks to AI optimism and everyone feeling positive about potential interest rate cuts by the Federal Reserve, and other major central banks, later in the year. Since late October, the S&P 500 has shot up about 28%, but there's some worry that the market is a bit exposed to some short-term profit-taking.
Looking ahead to the week: Chinese PMIs, German CPI and US non-farm payrolls
There are lots of key data coming up in the week ahead. Here are the top three events:
Chinese Manufacturing PMI
Monday, April 1
12:00 BST
Concerns over China’s economy have eased, especially following the government’s ambitious 5% growth target announcement and improvement in economic data. In more recent days, we have seen profits in the Chinese industrial sector surge, reaching levels not seen in 25 months, suggesting that the slowdown might be reaching its lowest point. Additionally, industrial production rose 7%, bolstering hopes for a recovery in commodities, nudging crude prices higher and keeping Chinese equities supported. If we see further evidence of accelerating output in Chinese factories via the PMI data, then this should further boost the newly found optimism surrounding the world’s second largest economy.
German Prelim CPI m/m
Tuesday, April 2
12:00 BST
In February, German CPI inflation stood at 2.5% year-on-year, hitting its lowest since June 2021, and nearing the ECB’s 2.0% target. The latest data for March will foreshadow the Eurozone CPI due for release on Wednesday. Several officials from the ECB have spoken about the need to see further evidence that Eurozone inflation is indeed heading towards its 2% goal, before cutting rates. Stock market investors are convinced, with the DAX hitting repeated all-time highs, with a June cut looking increasingly likely.
US NFP report
Friday, April 5
13:30 BST
Attention will turn to key data from the US, including the Non-Farm Payrolls report on Friday. Key US data for March, including this jobs and wages report, and CPI next week, is set for release in the first half of April and will hold considerable sway over the dollar's trajectory. Weakness in these figures, if seen, particularly in forthcoming wages and inflation data, could precipitate a sustained decline in the dollar. The week’s other US data highlights will include ISM manufacturing PMI on Monday, followed by JOLTS Job Openings on Tuesday, and ADP private payrolls and ISM services PMI on Wednesday.

S&P 500 analysis: technical factors and levels to watch
TradingView.com
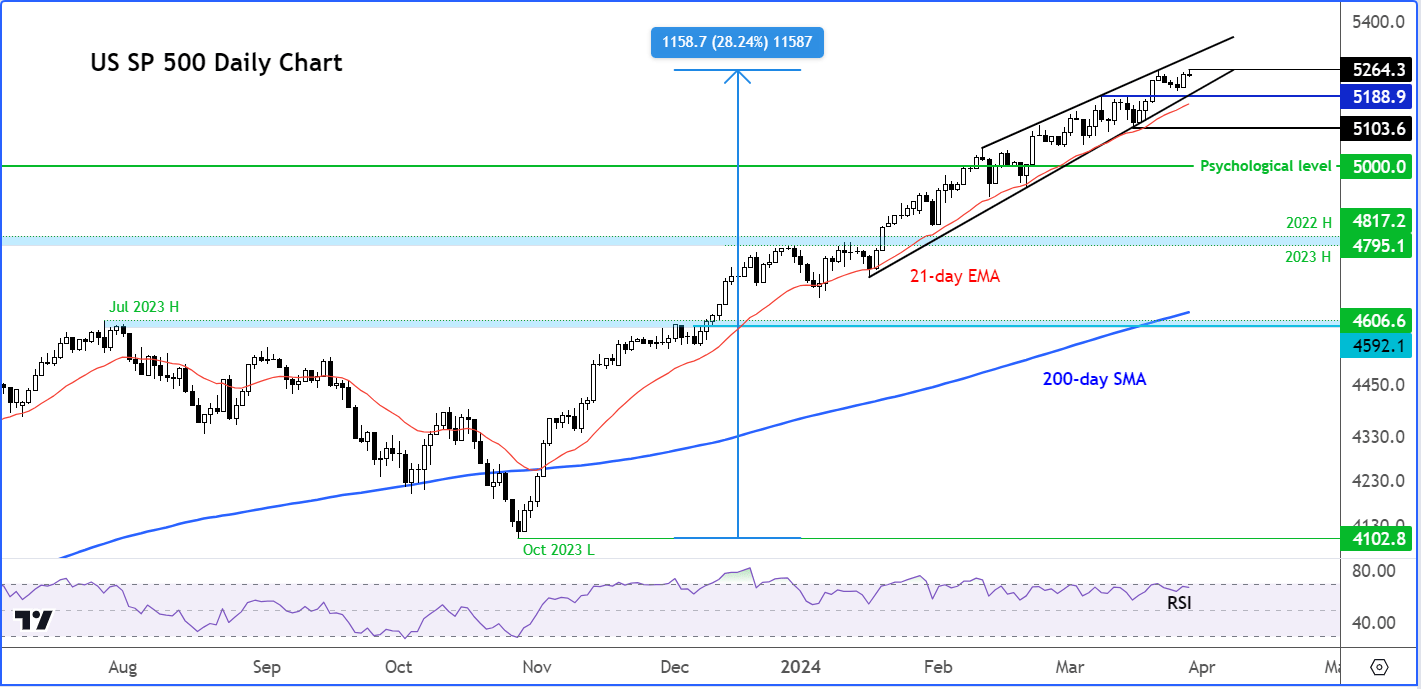
The S&P 500 chart continues to display a bullish characteristics, staying within an upward channel spanning several months with minor pullbacks. Since its low point last November, this index of major market-cap stocks has consistently reached higher highs and lows. Notably, it hasn't experienced even a 2% pullback during this period, underscoring the strength of the ongoing rally.
Given the clearly bullish trend, it doesn't make much sense to attempt to pinpoint the top until the charts signal an end to the bullish momentum. Moreover, the Relative Strength Index (RSI) hasn't reached extremely overbought levels yet. In this bullish cycle, whenever it has surpassed the 70 threshold, it has corrected its overbought conditions through consolidation rather than a significant sell-off. Hence, it's prudent for traders to continue focusing on dip-buying strategies until there's a shift towards a bearish trend.
Keeping this in mind, it's essential to monitor the support trend within the bullish channel, particularly in the 5180-5205 region. As long as this area remains intact, the bulls will likely remain satisfied, even if the index experiences some temporary retracement. The 5180 level also served as support after previously acting as resistance. Only if this area breaks will we entertain bearish ideas on the market.
On the upside, there isn't much resistance to contend with, given the repeated record highs. The bulls' next near-term target is liquidity above the previous all-time high of 5264 that was hit on Thursday, followed by the next round handle at 5300.
-- Written by Fawad Razaqzada, Market Analyst
Follow Fawad on Twitter @Trader_F_R
How to trade with City Index
You can trade with City Index by following these four easy steps:
-
Open an account, or log in if you’re already a customer
• Open an account in the UK
• Open an account in Australia
• Open an account in Singapore
- Search for the company you want to trade in our award-winning platform
- Choose your position and size, and your stop and limit levels
- Place the trade
Latest market news
Yesterday 01:32 PM
Yesterday 09:35 AM
Yesterday 07:23 AM
Yesterday 04:48 AM
Yesterday 12:17 AM
July 25, 2024 10:39 PM
Latest US 500 articles

July 25, 2024 01:30 PM

July 18, 2024 11:14 PM

July 18, 2024 11:35 AM

June 13, 2024 02:00 PM