


- Longer-dated US Treasury yields have tumbled over 60 basis points in a month
- The Nasdaq 100 has surged nearly 15% over the same period, leaving it looking tired on the charts
- USD/JPY remains well above levels seen earlier this year when benchmark yield differentials were similar to where they are today
After a near 15% rally in under a month, the high-flying Nasdaq 100 looks tired on the charts, struggling to add to gains despite a continued pullback in US bond yields. In contrast, USD/JPY gives the impression it’s only starting the process of adjusting to the more placid US yield environment.
US yield curve bull flattens after brutal selloff
After a brutal selloff following the Federal Reserve’s hawkish hold at the September FOMC monetary policy meeting, the rebound in USD Treasury prices since late October has been equally spectacular, resulting in massive declines in yields further out the US curve.
30-year US bond yield have tumbled over 60 basis points with benchmark 10-year US note yields down by a similar margin. Even 2-year Treasury note yields have skidded 35 basis points despite the Fed maintaining a unanimous public position that rates are likely to remain higher for longer until the inflation threat has been neutralised.
While the reversal only brings yields back to where they sat a couple of months ago, it’s clear the rates environment has shifted dramatically. You get the sense market concerns are morphing from inflation keeping policy rates in restrictive territory for a prolonged period to whether prior tightening will deliver a hard economic landing, creating a new front of uncertainty when it comes to the outlook for corporate earnings.
Nasdaq 100 gasping for air after massive rally
While the latter may not be a significant factor impacting the Nasdaq 100 given its constituents are valued on expected earnings growth in the future, movements in long bond yields are given the mechanics behind how the value of those earnings are calculated. As a rule of thumb, declining bond yields would normally act as a tailwind for long duration assets such as tech stocks. You can see that clearly in the daily chart below with the Nasdaq 100 ripping higher in November as benchmark 10-year Treasury yields fell.
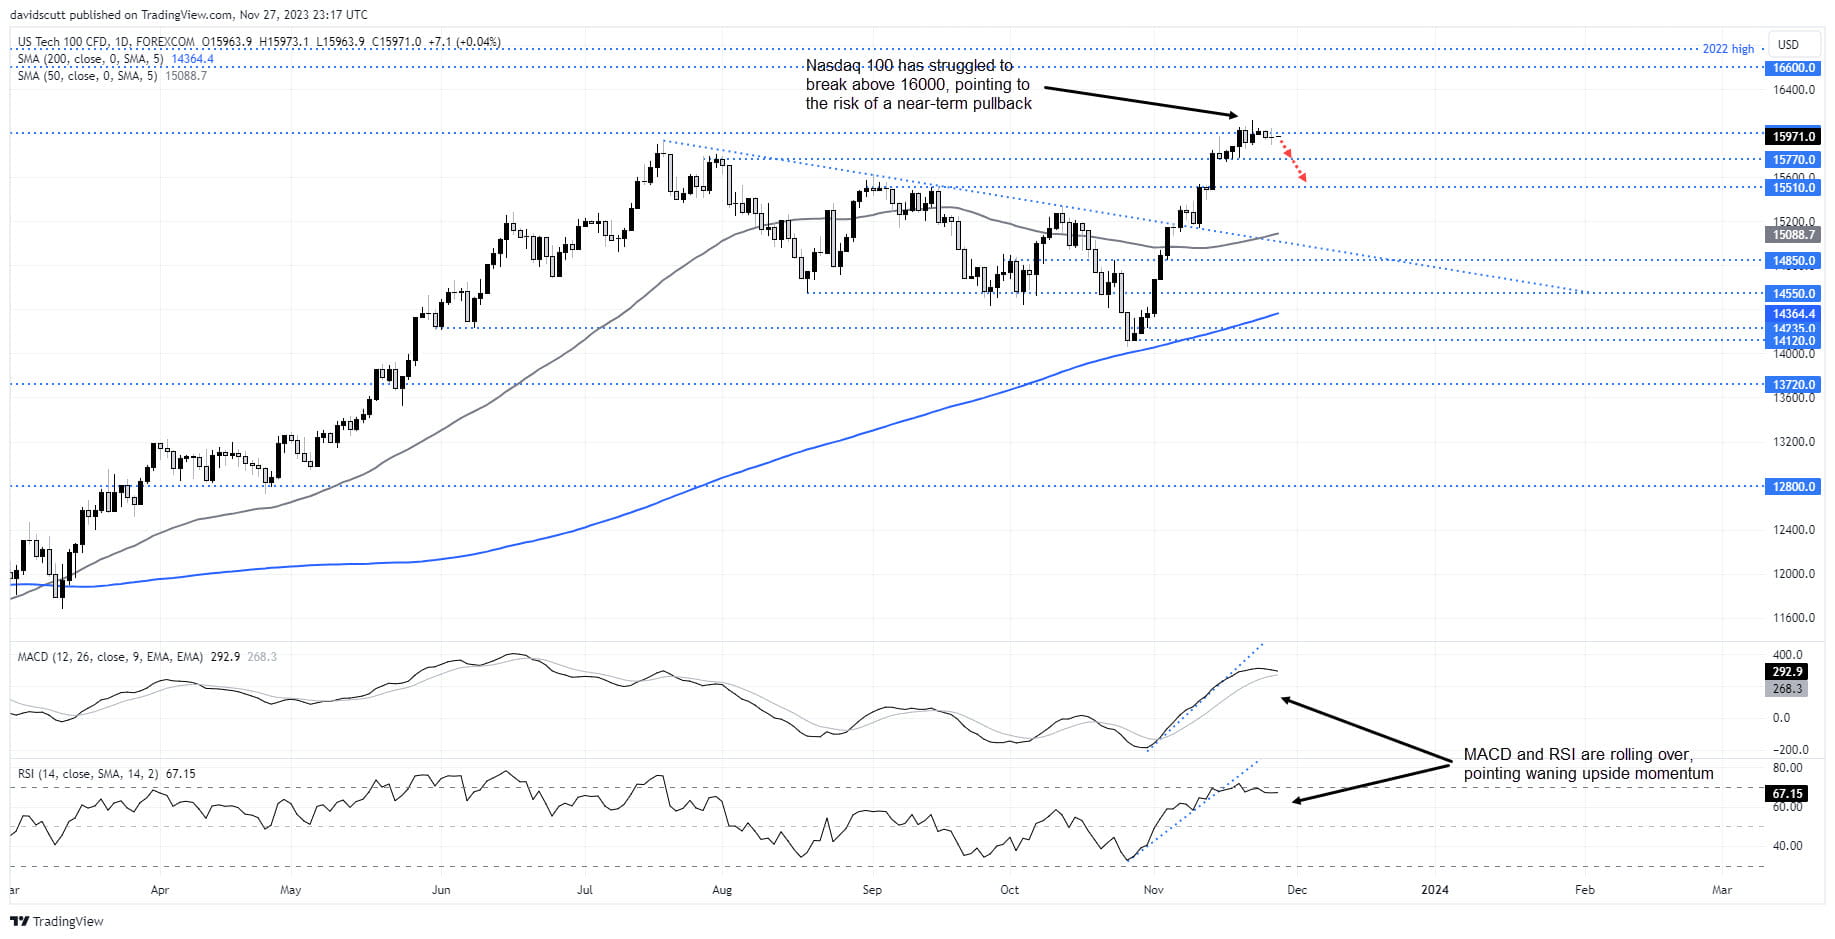
But the recent price action has been unconvincing. Just look at the failed attempts to break resistance parked above 16000 over the past fortnight. The Nasdaq 100 looks tired after such a monumental move, a view bolstered by MACD and RSI which are both rolling over. While the macroeconomic environment doesn’t point to the risk of a major pullback, the price action suggests the path of least resistance may be lower in the near-term.
For those considering shorts, support around 15770 and 15510 could be initial downside targets, with a stop above 16060 for protection. A modest pullback could also be a positive development for those who gold a longer-term bullish view, helping to encourage fresh buying.
USD/JPY looks rich relative to yield differentials
While the Nasdaq 100 has arguably overreacted to the move in US yields, you could argue another yield sensitive market – USD/JPY – has not, sitting within touching distance of multi-decade highs despite a meaningful compression in benchmark yield differentials which have fallen over 50 basis points from the recent highs. USD/JPY traded in the low to mid 140s when benchmark yield spreads were similar earlier this year, not the high 140s where it sits today. Purely from a rate differential perspective, price risks are skewed to the downside.

You can see how important the 50-day moving average has been in capping USD/JPY below 150 recently, contributing to the decline on Monday even before US Treasury yields fell. Right now, USD/JPY is testing support at 148.40 with a downside break likely to bring a push towards 147.50 into play. That’s where the pair found strong buying last week. Below 147.50, uptrend support dating back to earlier this year may come under threat. Conversely, should 148.40 hold, it may encourage another test of the 50-day moving average.
Looking at the known event risk calendar, only a seven-year US Treasury Note auction today, along with core US PCE inflation on Thursday, carry the potential to generate a meaningful reaction in USD/JPY and the Nasdaq 100 this week.
-- Written by David Scutt
Follow David on Twitter @scutty
How to trade with City Index
You can trade with City Index by following these four easy steps:
-
Open an account, or log in if you’re already a customer
• Open an account in the UK
• Open an account in Australia
• Open an account in Singapore
- Search for the market you want to trade in our award-winning platform
- Choose your position and size, and your stop and limit levels
- Place the trade
Latest market news
Yesterday 01:32 PM
Yesterday 09:35 AM
Yesterday 07:23 AM
Yesterday 04:48 AM
Yesterday 12:17 AM
July 25, 2024 10:39 PM
Latest Equities articles


June 8, 2024 02:00 AM

June 3, 2024 05:56 AM

June 3, 2024 03:34 AM