


Key takeaways
- The Nasdaq remains defiantly bullish, yet a resistance cluster looms nearby ahead of key inflation data and an FOMC meeting
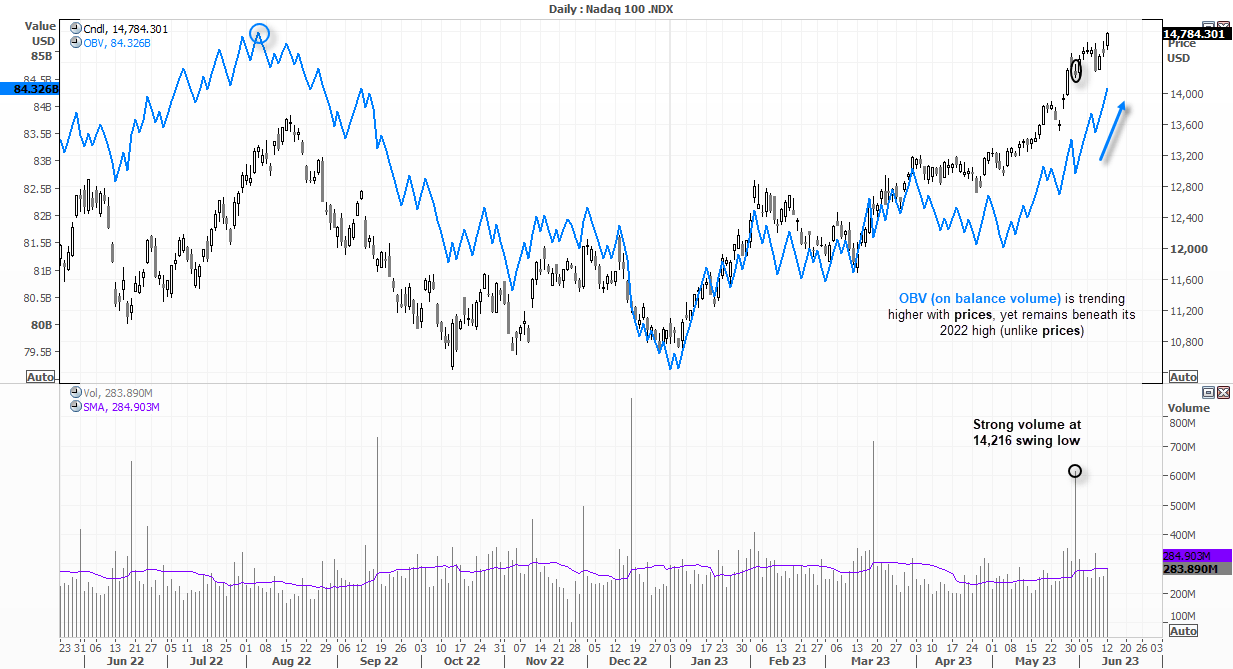
- Exceptionally heavy volumes at the 14,216 low mark it as an important structural level for bulls on the daily chart
- Nvidia (NVDA) is consolidating near its record highs, but we prefer bullish intraday setups around support over the near-term unless a clear breakout occurs
- Yet a runway gap on the daily chart – which tend to appear around the midway point of a trend – hints a higher highs further out
The Nasdaq’s rally has gone from strength to strength, having now risen over 40% from its October low, or 26.4% from the March low. I had pencilled in a potential pullback last week following Wednesday’s notable key reversal day at resistance. Yet it was clearly not to be, as prices failed to confirm the grizzly candle with a break of its low and instead opted for a bullish inside day and subsequent break to a new cycle high.
By yesterday’s close, the Nasdaq reached a fresh 14-month high, closed the April 5th gap and just above a 138.2% Fibonacci projection ratio. It seems that appetite for risk was given another boost as US consumer inflation expectations fell to a 2-year low of 4.1%, in anticipation of a softer US inflation report today and less hawkish Fed tomorrow. In all honestly, I’m not sure it makes a material difference to what the Fed will say at their next meeting, but market are behaving as though it will. A pause is almost a given, and I see no pressing reason for the Fed to deliver a ‘dovish pause’ given their concerns with inflation. And it would require a particularly soft inflation report today to convince me otherwise and send the Nasdaq higher, which leaves a downside risk for the Nasdaq should inflation rise unexpectedly, and / or the Fed are more hawkish than currently expected.
Nasdaq 100 daily chart:
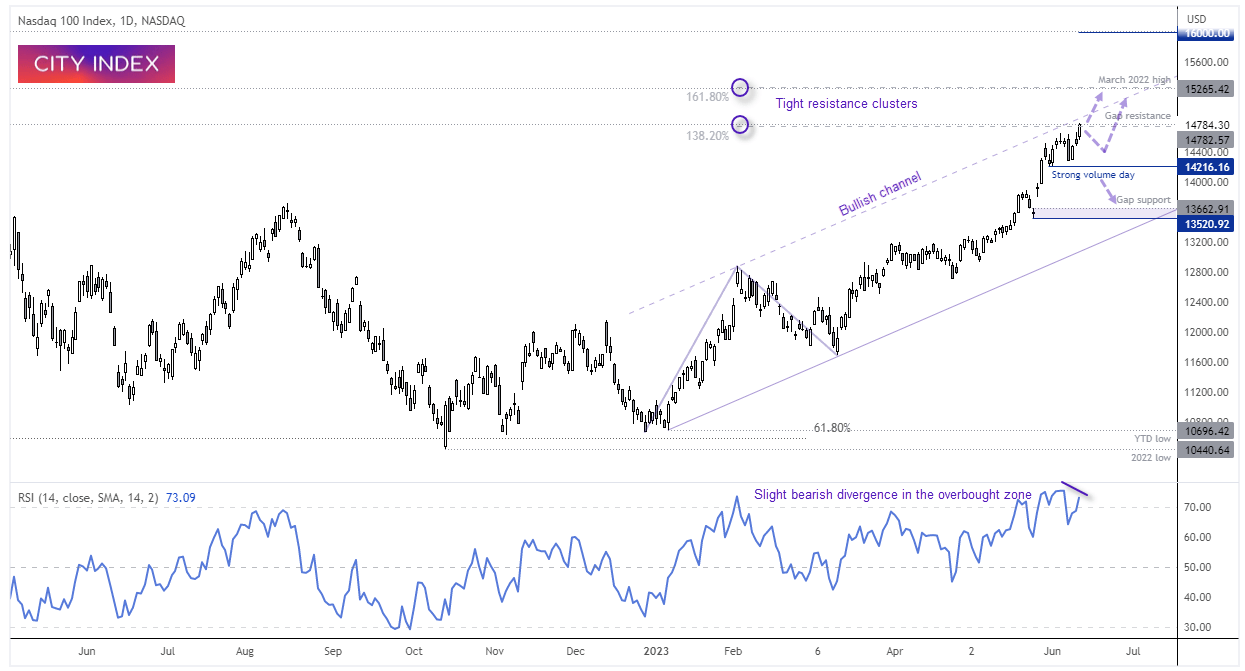
If we look at the daily chart of the Nasdaq, price action is undeniably bullish with momentum increasing with each leg higher. The OBV (on balance volume) indicator is also trending higher with prices to show strength during the rally.
But there are some warning signs to the rally brewing in the background. Whilst the OBV points higher, it has failed to break above its 2022 peak like prices, although this is more of a concern for the longer-term view. Over the near term, the rally has stalled around a resistance cluster including gap resistance, a 138.2% Fibonacci ratio and the upper trendline of its bullish channel just above. A slight bearish divergence has also formed on the RSI (14) within the overbought zone. The 14,216 low is deemed important due to the exceptionally high levels of volume that occurred that day, and that could temp bulls to buy the dip and support prices.
- If CPI is soft and / or the Fed is now as hawkish as we suspect, then a break above the current resistance cluster and move towards the March 2022 high seems plausible.
- Yet a hot CPI print could see prices pullback from current levels, with a hawkish FOMC meeting potentially dragging it closer to the 14,216 low.
- If prices break beneath the 14,216 low (and force bulls to capitulate and bears to enter), we have likely entered a correction and could see prices retrace further within the bullish channel.
Nvidia (NVDA), the consolidating champion of the Nasdaq
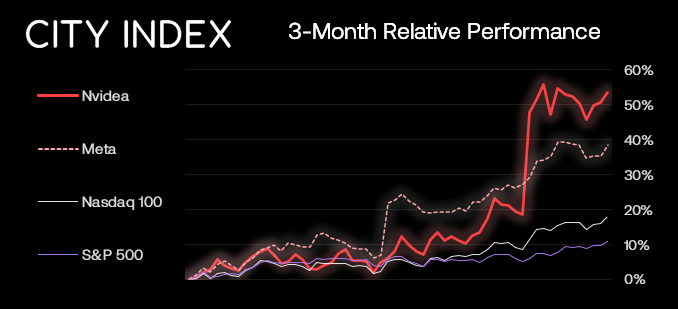
Whilst the Nasdaq has enjoyed being the outperformer of Wall Street thanks to the excitement surrounding AI, critics have been quick to point out that the broader market is less loved. So is this really a bull market? For the index, yes – for the broader market, perhaps not yet. This leaves equity investors with the choice between seeking value in the abundance of underperforming stocks within the index or seeking strength.
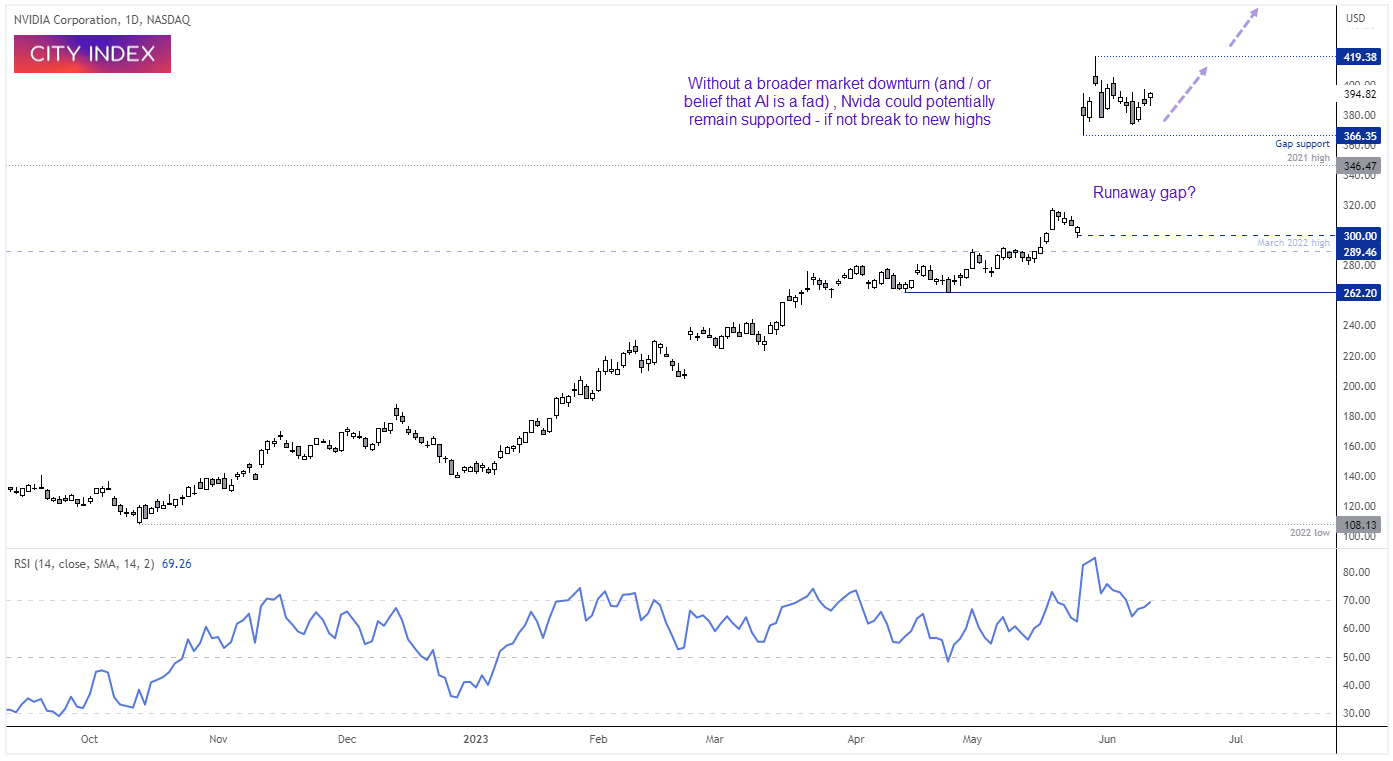
If we’d prefer to play with strength, then Nvidia (NVDA) is an obvious choice. It was the strongest performer in the Nasdaq back in April when we outlined our bullish bias, and a bumper earnings report sent it skyrocketing a further 50% to a new record high. Is it overvalue? Quite possibly. But until we see a material pullback in the broader market and investors begin to question whether AI is just another fad, it seems likely that Nvidia’s stock price could at least remain support (if not extend gains further).
And given the runaway gap that formed – which tend to appear around the halfway point of strong trends – we favour an eventual break to new highs.
Yet due to the technical case that prices are potentially stretched to the upside, we’d prefer to seek bullish opportunities on intraday timeframes and wait for a healthy correction (or breakout) before reconsidering longs on the daily timeframe or higher.
Nvidia 1-hour chart:
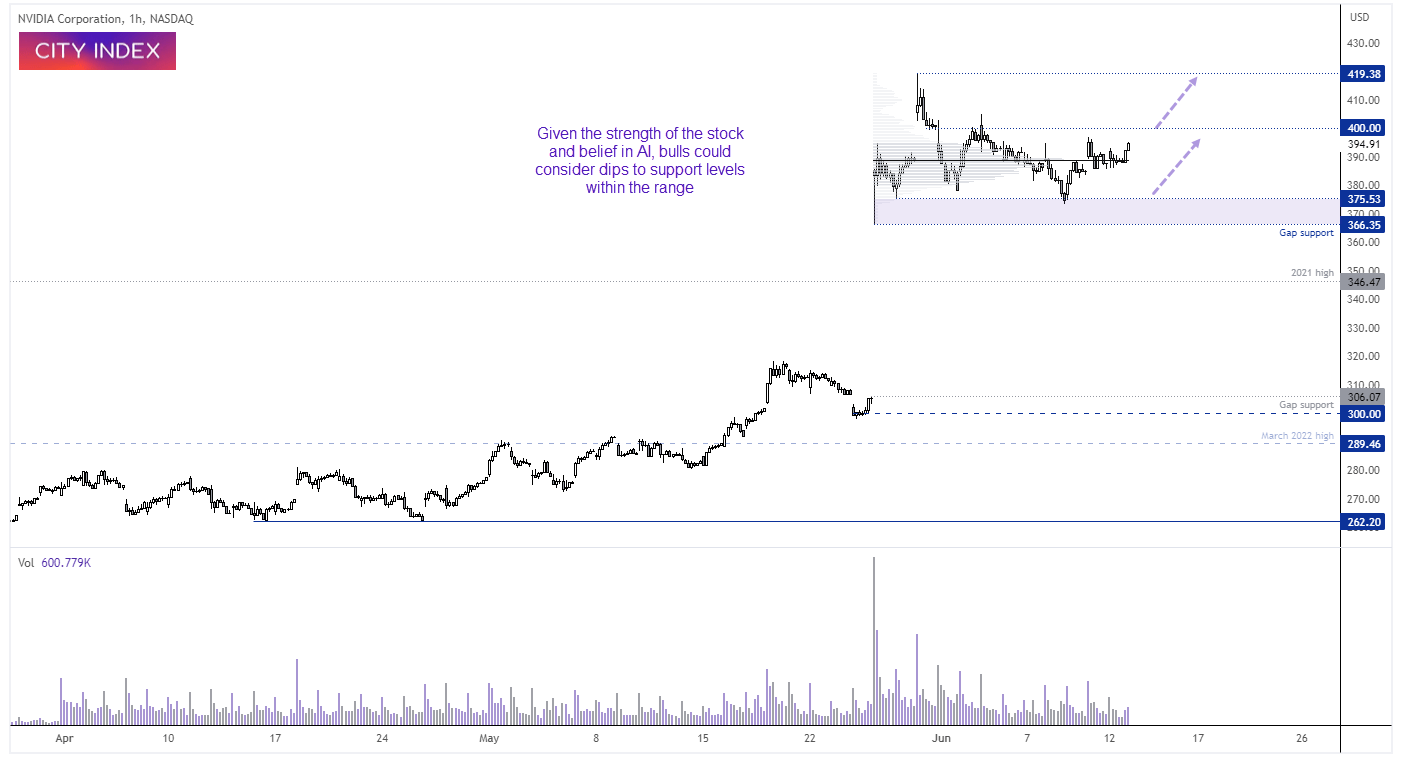
Prices are consolidating near the highs, with the majority of trading volume occurring ~$390. Tis level can provide a degree of support and tempt intraday bulls back to the table, but if prices head for the $366 - $375 lows, we’d consider bullish setups with $390 and $400 being potential upside targets.
A break below $366 risks a pullback towards the 2021 high around $346 - $350, and it could take a broader market downturn to send it back towards $300.
Until then, we prefer dips around support levels and a potential break top new highs – given the breakaway gap that formed on the daily chart which tend to occur around the halfway point of a strong trend.
-- Written by Matt Simpson
Follow Matt on Twitter @cLeverEdge
How to trade with City Index
You can trade with City Index by following these four easy steps:
-
Open an account, or log in if you’re already a customer
• Open an account in the UK
• Open an account in Australia
• Open an account in Singapore
- Search for the market you want to trade in our award-winning platform
- Choose your position and size, and your stop and limit levels
- Place the trade
Latest market news
Today 05:56 AM
Yesterday 11:57 PM
Yesterday 08:00 PM
Yesterday 02:00 PM
Latest Trade Ideas articles

Yesterday 11:57 PM

April 26, 2024 11:40 AM

April 25, 2024 03:00 PM

April 25, 2024 11:14 AM