


Following the release of disappointing US data and company earnings, we saw bond yields take a nosedive ahead of the FOMC policy decision later in the day. The benchmark US 10-year bond yield dropped to 3.95%, and this helped to underpin gold and silver, caused the USD/JPY to slip below 146.50. All of a sudden, the market pricing of rate cuts for 2024 jumped to 145 basis points compared to 130 bps earlier in the week, with the odds of a March cut rising back to 65% from around 45% before the data release. However, with the FOMC decision looming, I wouldn’t be surprised if these moves reverse.

US data disappoints
- ADP private payrolls 107K vs. 148K expected and 158K last
- Chicago PMI 46.0, Exp. 48.0, Last 47.2
- Employment Cost Index q/q +0.9% vs. 1.0% expected and +1.1% last
Gold analysis: Attention turns to FOMC
During tonight's FOMC meeting, the Federal Reserve is likely to convey a cautious message, which may keep yields underpinned. Recent communications from key Fed officials like Christopher Waller suggest that a rate cut in March is unlikely, despite the market's persistent anticipation. Despite the market assigning a 65% probability to a March rate cut, a firm stance from the Fed provides room for the dollar to strengthen and thereby cause gold to weaken
It would be surprising if the Fed adopts a dovish stance, given the consistently robust US economic data, apart from those released earlier. The Fed is expected to emphasize that while inflation and the job market are progressing positively toward a soft landing, they are not in a hurry to implement rate cuts. When rate cuts are eventually here, they are likely to be more measured than in previous instances.
Gold technical analysis
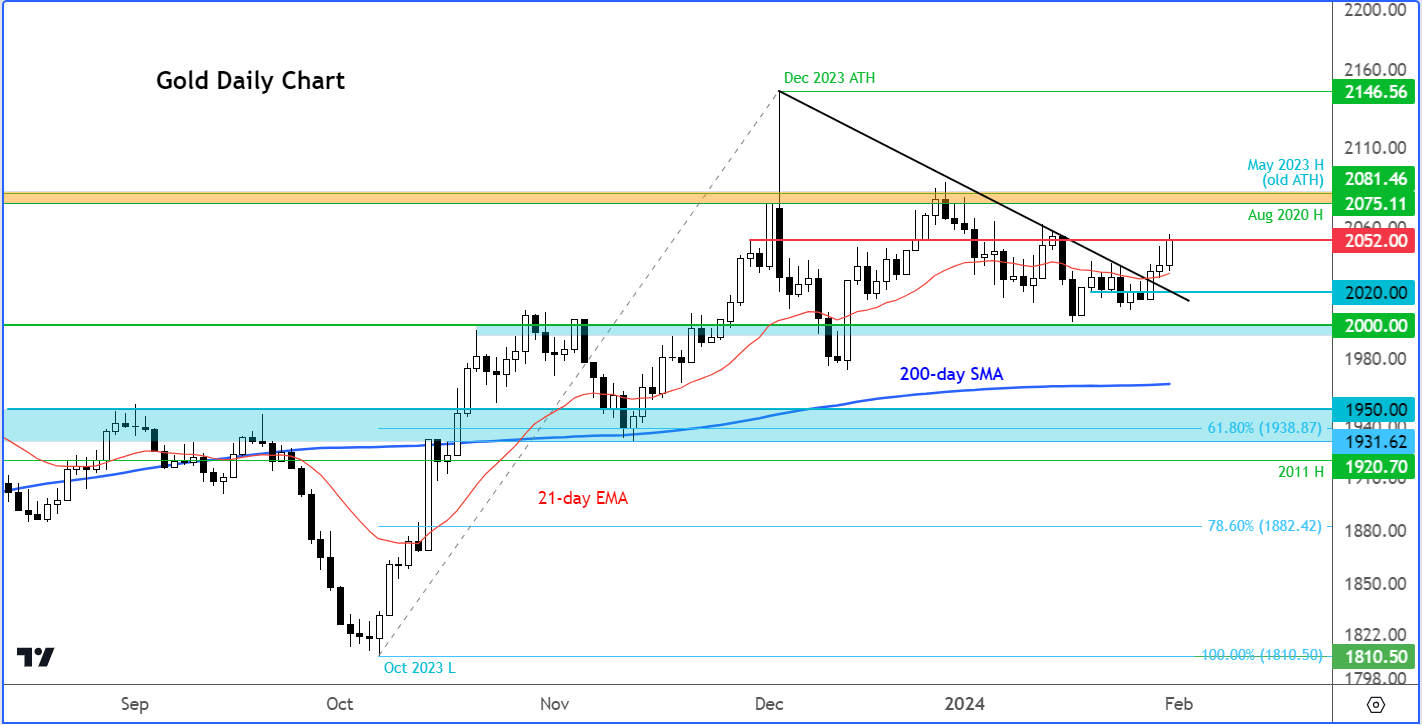
Source: TradingView.com
Gold was up for the third day and holding above the 21-day exponential moving average around $2030. It was also above the broken short-term bear trend. At the time of writing, it was testing key resistance in the $2050/55 area, where the metal had sold off from last time. A close above this area would tip the balance in the bulls favour. A couple of support levels to watch on the downside include $2020 and then $2000.
-- Written by Fawad Razaqzada, Market Analyst
Follow Fawad on Twitter @Trader_F_R
How to trade with City Index
You can trade with City Index by following these four easy steps:
-
Open an account, or log in if you’re already a customer
• Open an account in the UK
• Open an account in Australia
• Open an account in Singapore
- Search for the company you want to trade in our award-winning platform
- Choose your position and size, and your stop and limit levels
- Place the trade
Latest market news
Yesterday 06:37 AM
April 26, 2024 01:25 PM
April 26, 2024 11:40 AM
Latest Gold articles

April 1, 2024 01:09 PM

March 28, 2024 10:30 AM

March 26, 2024 11:24 PM

March 26, 2024 12:00 PM