


Market Summary:
- Wall Street held on to gains set early in the week but trade in small ranges near their multi-month highs. The question this week is whether there is enough juice in the tank to rally into Thanksgiving on Thursday, which tends to have been the case looking at stats over the past 36 years
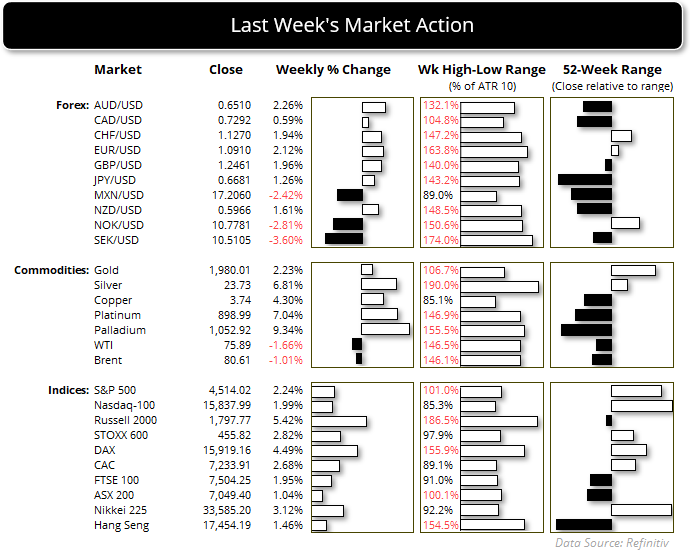
- The US dollar was the weakest forex major last week and fell against all of its major peers, as markets are once again convinced that the Fed have no more hikes up their sleeve following weaker-than-expected inflation figures
- US bond yields continued to weaken which saw the 10-year yield fall to a 2-month low of 4.4%. Yet as it has fallen to trend support on the daily chart with a small doji on Friday, perhaps we’ll see some technical selling of bonds over the near-term which could be supportive of yields and the US dollar.
- The Japanese yen was the strongest FX major and formed which saw USD/JPY form a 2-week bearish reversal pattern, which begs the question as to whether we’re going to see further weakness ahead.
- With USD/CNH falling to a 3-month low, it could place upwards pressure on other APAC currencies such as the yen over the coming weeks
- UK retail sales contracted -0.3% in October to bolster bets that the BOE will be the first major central bank to cut rates in 2024
- It seems that no sooner had Bloomberg noted that crude oil had entered a technical bear market with a 20% fall, bulls rushed back to bid it higher. Time and time again I see this, prices move the opposite way as soon as ‘bull market’ and ‘bear market’ headlines hit the wire.
- Whilst I still see the potential for it to fall to $70, perhaps a move towards its 200-day MA around $78 is in order first.
- Gold’s rebound tapped the 1985 target, but Friday’s small gravestone doji hints at a probably swing high on the daily chart beneath the $2000 handle (bias is currently flat)
See how the S&P 500 has performed heading into Thanksgiving: Forward testing the S&P 500 around Thanksgiving
Events in focus (AEDT):
- 12:15 – PBoC loan prime rate
- 16:00 – ECB Lane speaks
- 18:00 – German PPI
- 21:00 – EU construction output
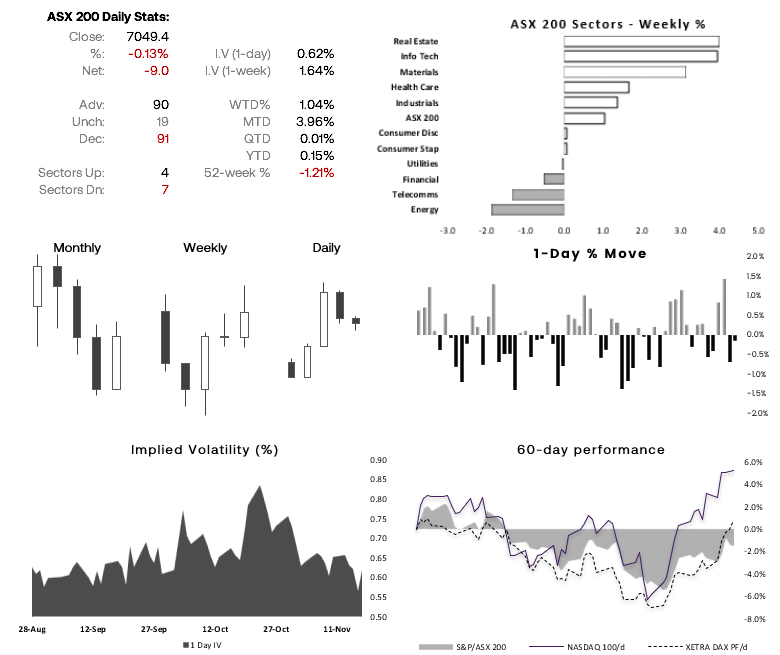
ASX 200 at a glance:
- The ASX 200 formed a bullish engulfing week and reached our 7100 target before pulling back to 7050.
- Thursday and Friday were down days, yet remained within Wednesday/s range and Friday’s lack of volatility suggests the ASX may be trying to form a swing low.
- Like AUD/USD, is it trying to muster up the strength for its next leg higher?
- From here, we’re looking for evidence of a swing low to form (perhaps a bullish engulfing candle or a bullish hammer on the 1-hour chart) to increase confidence it can retest and potentially break above last week’s high
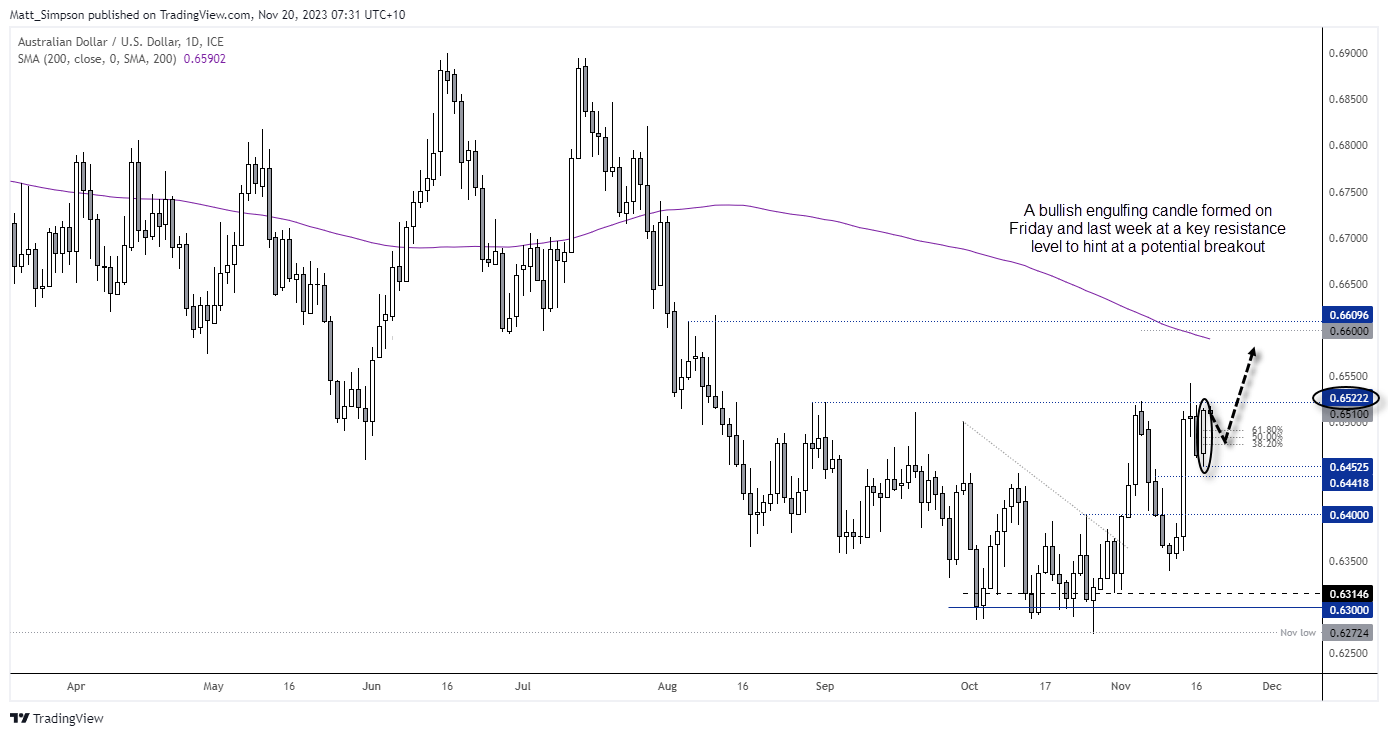
AUD/USD technical analysis (daily chart):
The Australian dollar formed a bullish engulfing week and closed just beneath the 0.6522 resistance level, which suggests a breakout could be pending. A bullish engulfing day also formed on Friday which places support at 0.6450. The question now is how bulls can get involve. Entering around current levels could lead to a false break, so perhaps low volatility retracement within Friday’s range could appeal as it could increase the potential reward to risk ratio for an anticipated breakout, for a move towards the 66c handle near the 200-day EMA,
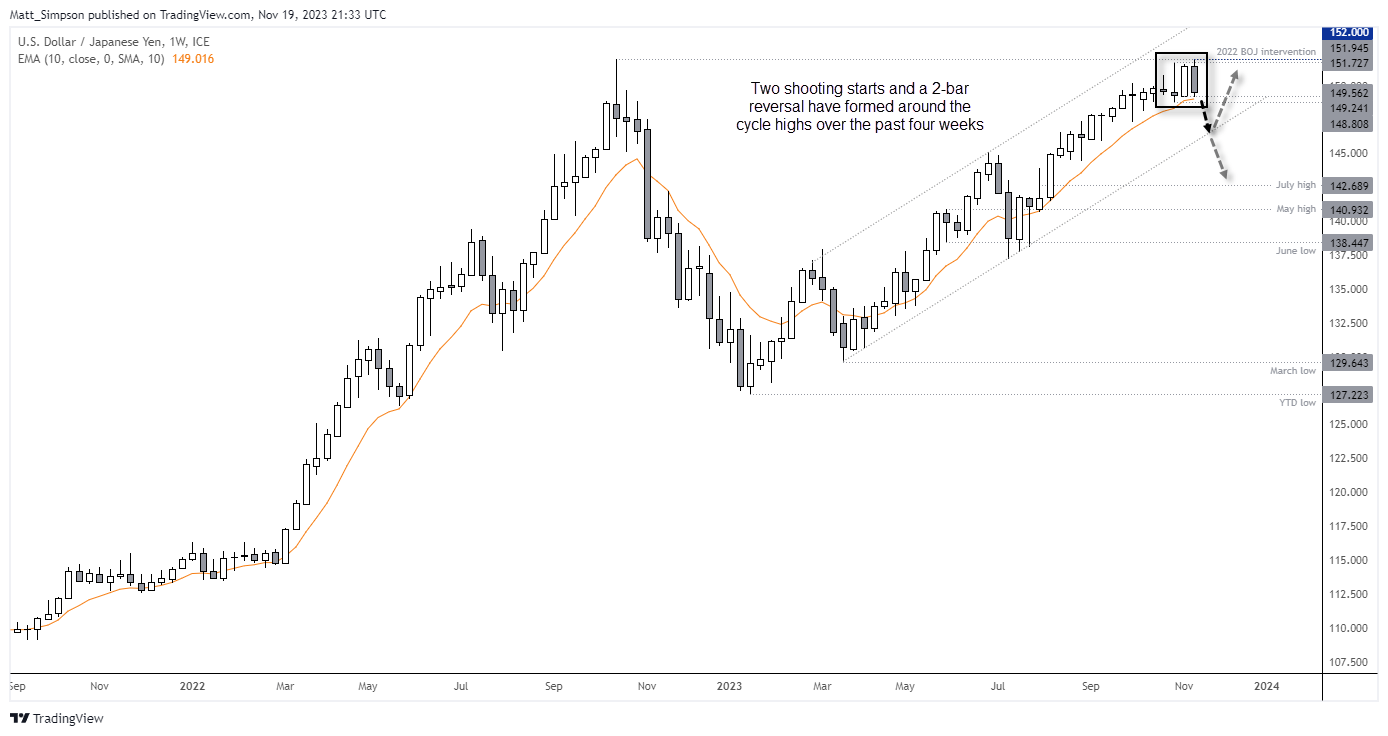
USD/JPY technical analysis (weekly chart):
“Tops are a process bottoms are an event” springs to mind when I look at the USD/JPY weekly chart. Whilst the trend is clearly bullish, there is a hesitancy to break above the 2022 intervention high, and the past four week has seen two shooting stars and a 2-bar reversal form (dark cloud cover). And with USD/CNH selling, hawkish headlines for BOJ resurfacing and the US dollar weakening, perhaps a move lower is the path of least resistance over the coming week for USD/JPY. A break beneath the 10-week EMA could mark such an event.
View the full economic calendar
-- Written by Matt Simpson
Follow Matt on Twitter @cLeverEdge
How to trade with City Index
You can trade with City Index by following these four easy steps:
-
Open an account, or log in if you’re already a customer
• Open an account in the UK
• Open an account in Australia
• Open an account in Singapore
- Search for the market you want to trade in our award-winning platform
- Choose your position and size, and your stop and limit levels
- Place the trade
Latest market news
Today 01:39 PM
Today 11:05 AM
Latest Asian Open articles

April 23, 2024 11:09 PM

April 22, 2024 10:48 PM

April 18, 2024 11:27 PM

April 17, 2024 11:16 PM