


Market Summary:
- Wall Street rallied for a fourth day which saw the S&P 500 enjoy its best day in six months
- A rise in iPhone sales offset falls in Mac and iPads help Apple beat quarterly earnings expectations, which saw the stock rise % on Thursday yet trade -1.3% lower during afterhours-trade
- The BOE held their interest rate steady for a second month at 5%, although kept the door open for further hikes if price pressures persisted. However, three voted to hike – above the 2 expected, so the hold was not quite as dovish as expected. And not that they needed to, but the BOE ruled out quick cuts.
- This places them in line with the Fed and ECB with being in pause mode yet not ready to declare a peak cycle (even if markets strongly suspect all three have reached their terminal rates)
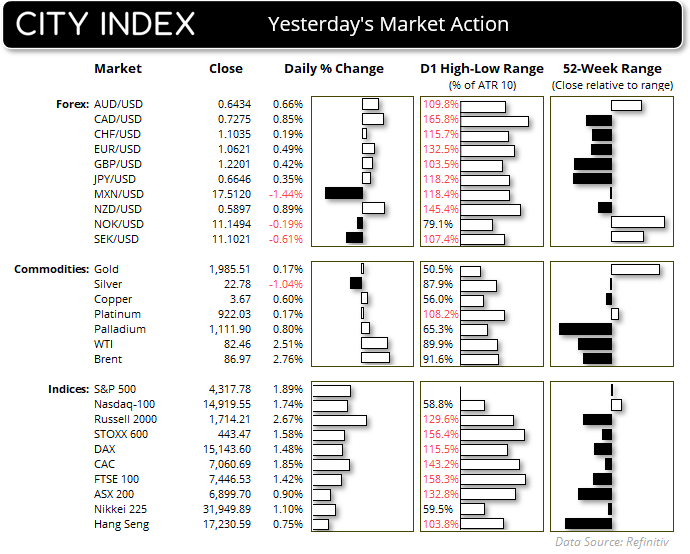
- The mid to higher end of the US yield curve continued to retrace on Thursday and the US dollar was again the weakest FX major
- The US dollar index closed at a 2-day low although saw a 7-day intraday low. Price action now remains contained within a choppy sideways range between the 105.50 – 107 area, and with the Jan and March lows nearby for potential support, it likely caps any runaway gains for EUR/USD
- For this reason, I suspect traders may be best seeking intraday setups across forex major and not looking for oversized moves without a macro catalyst
- With that said, the Canadian surged against the US dollar which saw USD/CAD suffer its worst day in four months.
- AUD/USD rose initially rose to a 24-day high before pulling back below 0.6450, but with a clear break above 0.64 the pair remains in my ‘buy the dip’ watchlist for a potential move to 0.6500
Events in focus (AEDT):
- Public holiday in Japan
- 09:00 – Australian services PMI
- 09:30 – ECB’s Schnabel speaks
- 10:50 – RBA assistant governor Jones speaks
- 11:30 – Australian retail sales (revised)
- 12:45 – China manufacturing PMI (Caixin)
- 16:00 – Singapore retail sales
- 18:00 – German trade balance
- 23:30 – Nonfarm payroll
ASX 200 at a glance:
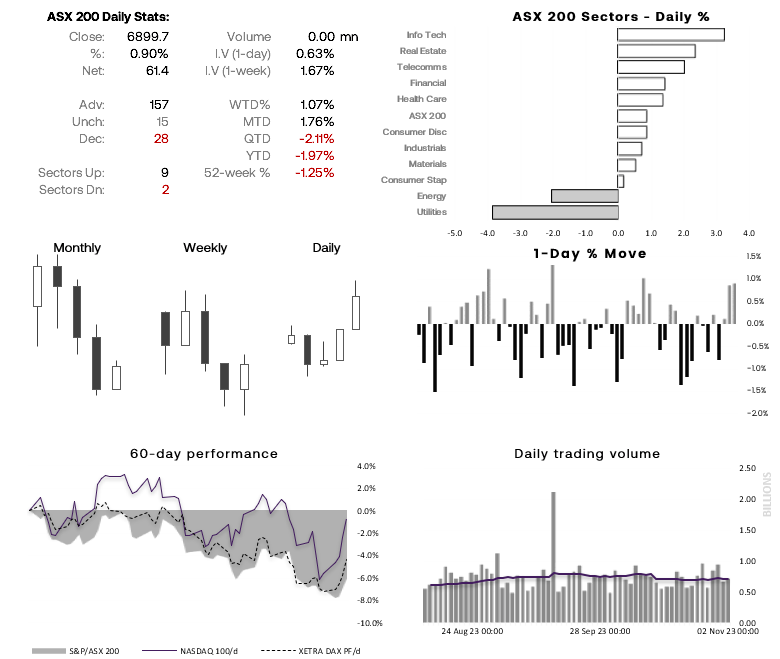
- The ASX 200 cash index enjoyed its best daily performance in three weeks on Wednesday to provide further evidence an important swing low may have formed on Monday
- 9 of the 11 ASX sectors rose on Wednesday, led by real estate and healthcare sectors
- A fly in the ointment for any runaway rally may be a hawkish RBA on Tuesday, but that could still allow the ASX time to extend a countertrend move heading into the weekend – assuming Wall Street and APAC stocks extend their gains
- Furthermore, its rally stalled around a key area of resistance including the 6900 handle, 20-day EMA and 50% retracement level
- It therefore may require a strong response from APAC stocks for the ASX to get swept away and produce a solid break of daily close above this level, or risks choppy trade around resistance
- Given the multi-week bullish divergence, an eventual upside break is the bias
- Yet with the RSI (2) in overbought with prices beneath a resistance zone, perhaps a pullback could help with a better-timed dip to consider around a lower support level
- In either case, I suspect 7,000 may also provide strong resistance
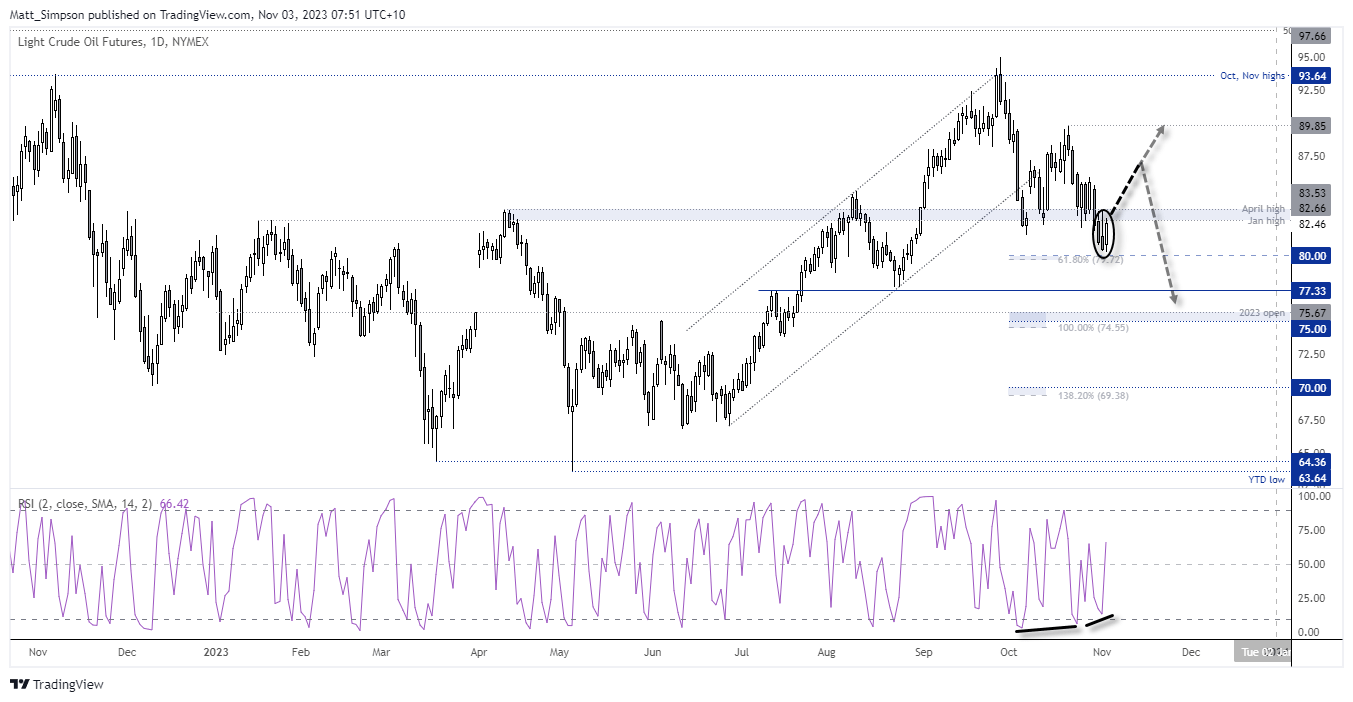
WTI crude oil technical analysis (daily chart):
Oil prices snapped a 3-day losing streak on Thursday, and whilst WTI crude didn’t quite meet the minimum objective of $80 – near the 61.8% Fibonacci projection, it came close enough to suggest a swing low may have formed. A bullish RSI has also formed on RSI (2). The Jan and April highs provided support initially so may provide resistance – but ultimately I suspect a bounce from current levels could be due. Whether this markets the end of an ABC correction and strong rally remains to be seen, so I’ll keep an open mind for its upside potential (or lack of from here). But if we see evidence of a swing high forming on the daily chart – such as a bearish engulfing/outside day, hammer or series of reversal candles, the $75 and $70 targets come back into focus.
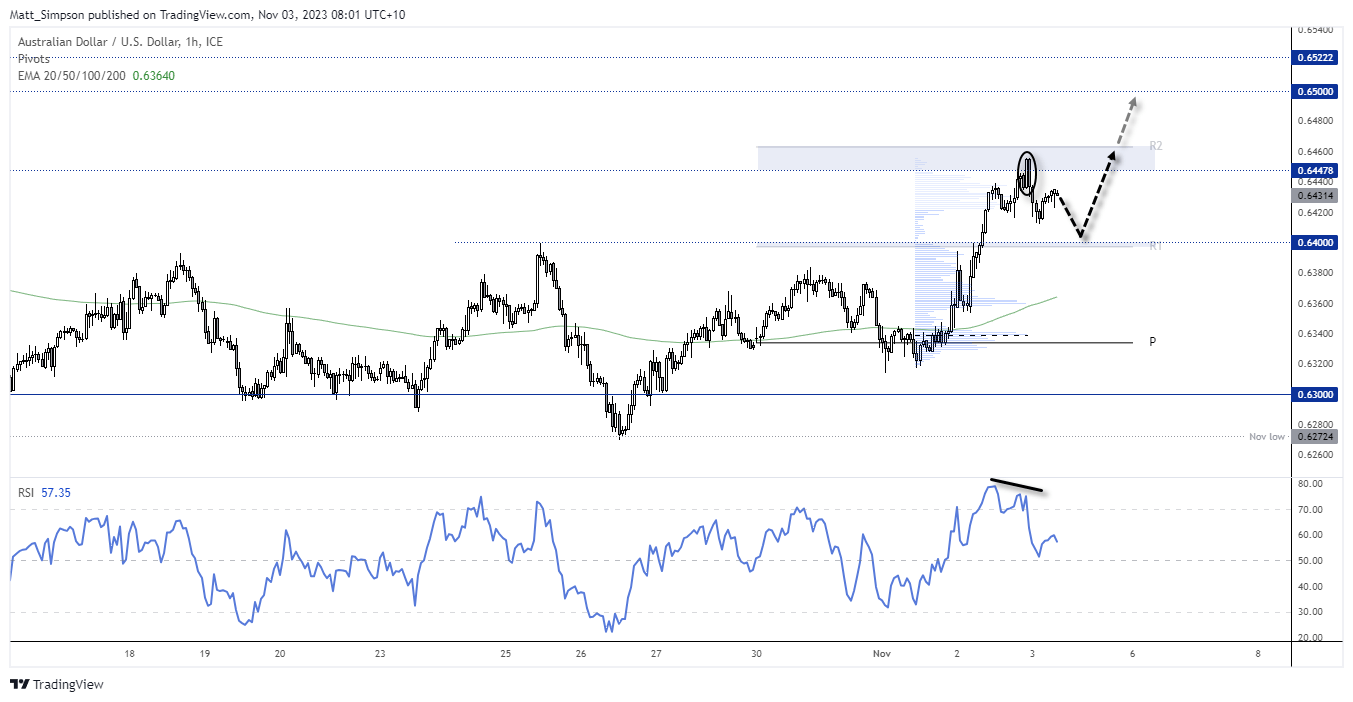
AUD/USD technical analysis (1-hour chart)
The Aussie saw a decent break above 64c on Thursday, and that brings the potential for a run for 65c whilst the US dollar and yields continue to retrace. However, a 2-bar reversal formed around 0.6450 resistance / weekly R2 pivot point alongside a bearish RSI divergence, so AUD/USD may have entered a 3-wave retracement (which assumes another leg lower). If you look to the volume profile to the left, you’ll notice a lack of trading activity around the initial breakout area, so that ‘liquidity gap’ may get filled if prices pull back far enough. In which case, look for the 64c area / weekly R1 pivot to hold as support and for a potential swing low, on the assumption it can break to new highs and head for 65c.
View the full economic calendar
-- Written by Matt Simpson
Follow Matt on Twitter @cLeverEdge
How to trade with City Index
You can trade with City Index by following these four easy steps:
-
Open an account, or log in if you’re already a customer
• Open an account in the UK
• Open an account in Australia
• Open an account in Singapore
- Search for the market you want to trade in our award-winning platform
- Choose your position and size, and your stop and limit levels
- Place the trade
Latest market news
Today 01:39 PM
Today 11:05 AM
Today 10:46 AM
Latest Asian Open articles

April 23, 2024 11:09 PM

April 22, 2024 10:48 PM

April 18, 2024 11:27 PM

April 17, 2024 11:16 PM