


- WTI analysis: What’s moving crude oil prices?
- WTI technical analysis: possible bottoming patterns
Crude oil prices started the week on the backfoot before turning positive at the time of writing. The recovery comes after prices started to stabilise at the end of last week, following a sharp 3-week decline despite Israel’s increased military operation in Gaza. Have oil prices finally bottomed?
WTI analysis: What’s moving crude oil prices?
Oil prices have fallen sharply from the peak in the final week of September, when WTI nearly reached $95 per barrel. Signs of slowing demand in the US and China offset the ongoing supply cuts from the OPEC+ group, and the potential for supply disruptions in the Middle East owing to the risk of spill over of the conflict in Gaza to other oil-rich nations. This has thankfully not happened yet, which is why investors have completely ignored geopolitical risks. But with oil prices correcting lower, much of the negative influences are likely to be priced in by now. It is worth remembering that oil prices are demand-inelastic, meaning that changes in things that influence demand for oil will have little influence on prices, compared to supply-side factors.
The OPEC and its allies will meet on November 26th to discuss policy. Given that oil prices have weakened in the last few weeks, Saudi Arabia and Russia will likely continue with their voluntary supply cuts into next year. This should therefore limit the downside potential. Meanwhile, US energy firms cut the number of oil rigs for a second week to the lowest level since January 2020, according to the Baker Hughes rig count. This is a sign that growth in non-OPEC supply could drop, which should keep prices supported all else being equal.
WTI analysis: technical levels to watch
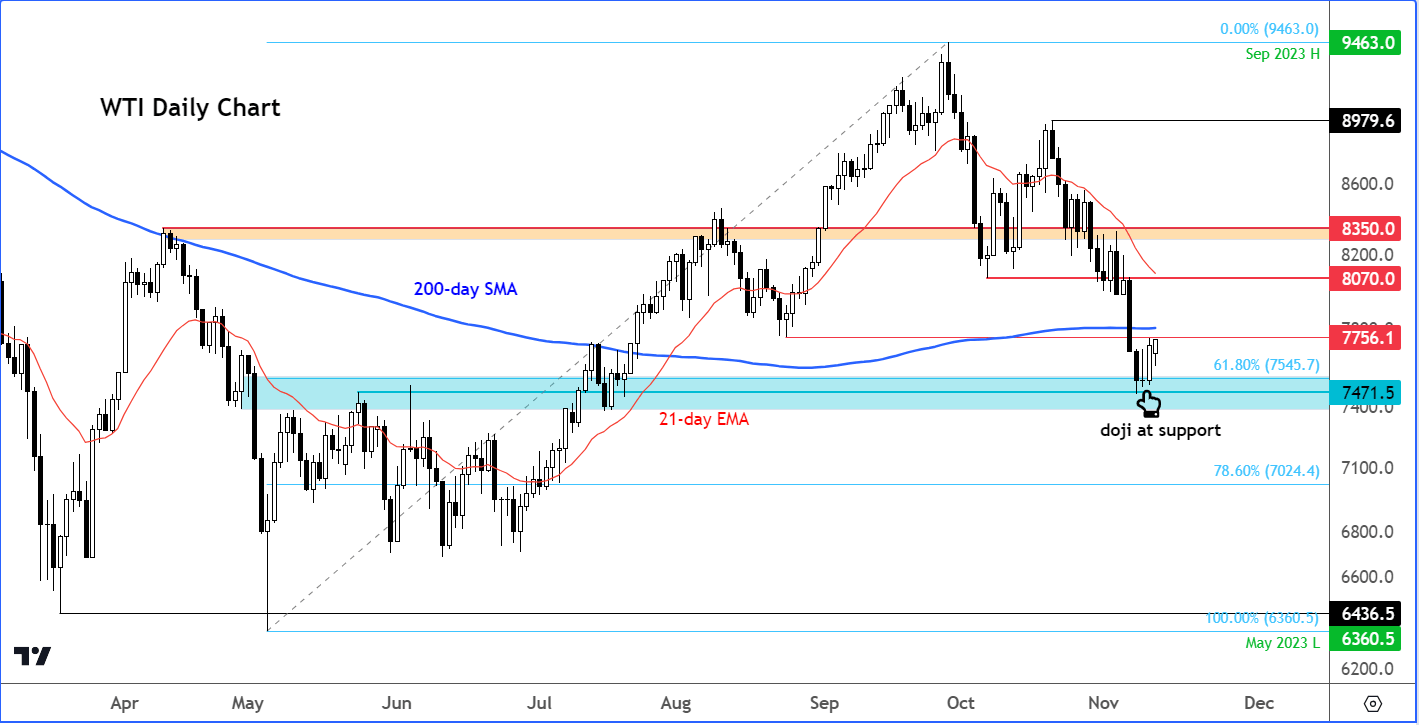
Source: TradingView.com
WTI has spent the last few sessions holding steady around a key support area in the $74.50 to $75.50 region. This $1 support range is where we the prior resistance-turned-support level meets the 61.8% Fibonacci retracement level against the rally that commenced in May. Given the sharp 15% drop to this level in the past few weeks, I am not surprised to see prices stage a bit of a recovery here, at this key support zone. But will this turn more than just an oversold bounce? That’s the key questions.
So far, we have seen the formation of a doji followed by a bullish engulfing candle at the end of last week. These patterns can be found at or near the bottom of a trend, indicating a reversal in the trend. But on their own they are not enough; we need to see evidence that the bullish reversal has conviction and momentum behind it.
There are a few overhead resistance levels to watch in order to gauge the strength of this recovery. First up is the August low at $77.56, which gave way during last week’s sell-off. The bulls will want to reclaim this level on a daily closing basis. Next up, the 200-day average comes just above that level, at around $78.00.
If we see WTI rise back above these levels and hold there, then this will give confidence to the bulls waiting on the side-lines to come back into the game. Otherwise, it may be worth waiting on the side lines for a bit longer until we see a clear bottom emerge. Given the situation in the Middle East and the OPEC+ ongoing intervention, shorting oil in the current environment is akin to playing with fire. So, I am not even entertaining the idea of it.
-- Written by Fawad Razaqzada, Market Analyst
Follow Fawad on Twitter @Trader_F_R
How to trade with City Index
You can trade with City Index by following these four easy steps:
-
Open an account, or log in if you’re already a customer
• Open an account in the UK
• Open an account in Australia
• Open an account in Singapore
- Search for the company you want to trade in our award-winning platform
- Choose your position and size, and your stop and limit levels
- Place the trade
Latest market news
Yesterday 01:32 PM
Yesterday 09:35 AM
Yesterday 07:23 AM
Yesterday 04:48 AM
Yesterday 12:17 AM
July 25, 2024 10:39 PM
Latest Crude Oil articles

July 25, 2024 05:30 PM
July 18, 2024 10:00 AM

July 16, 2024 12:09 PM
July 15, 2024 07:18 AM