


Analyst estimates were overly optimistic with their lower CPI forecasts, and the upside surprises should serve as a reminder that the Fed do not expect the path back to inflation to be easy. It hasn’t been during previous cycles, so why should this one be so different? Markets are always in such a rush to price the future in now that they forget that the Fed moves at the Fed’s pace. This means that they overact to every fluctuation in economic data as they extrapolate expectations out from single data points. When in reality, the Fed are taking a long-view approach and their ‘path’ back to 2% allows for mishaps along the way. And comments from Goolsbee and Powell after the hot inflation report attest to this.
Besides, the Fed’s preferred CPI gauge is the less-volatile core PCE, and if that comes in softer then markets will no doubt forget this week’s hot inflation report from the BLS. And it looks like they’re already trying to with Wall Street recouping around half of Tuesday’s losses and the VIX retracing lower. But this could just be a sympathy bounce thanks to a pullback in yields.
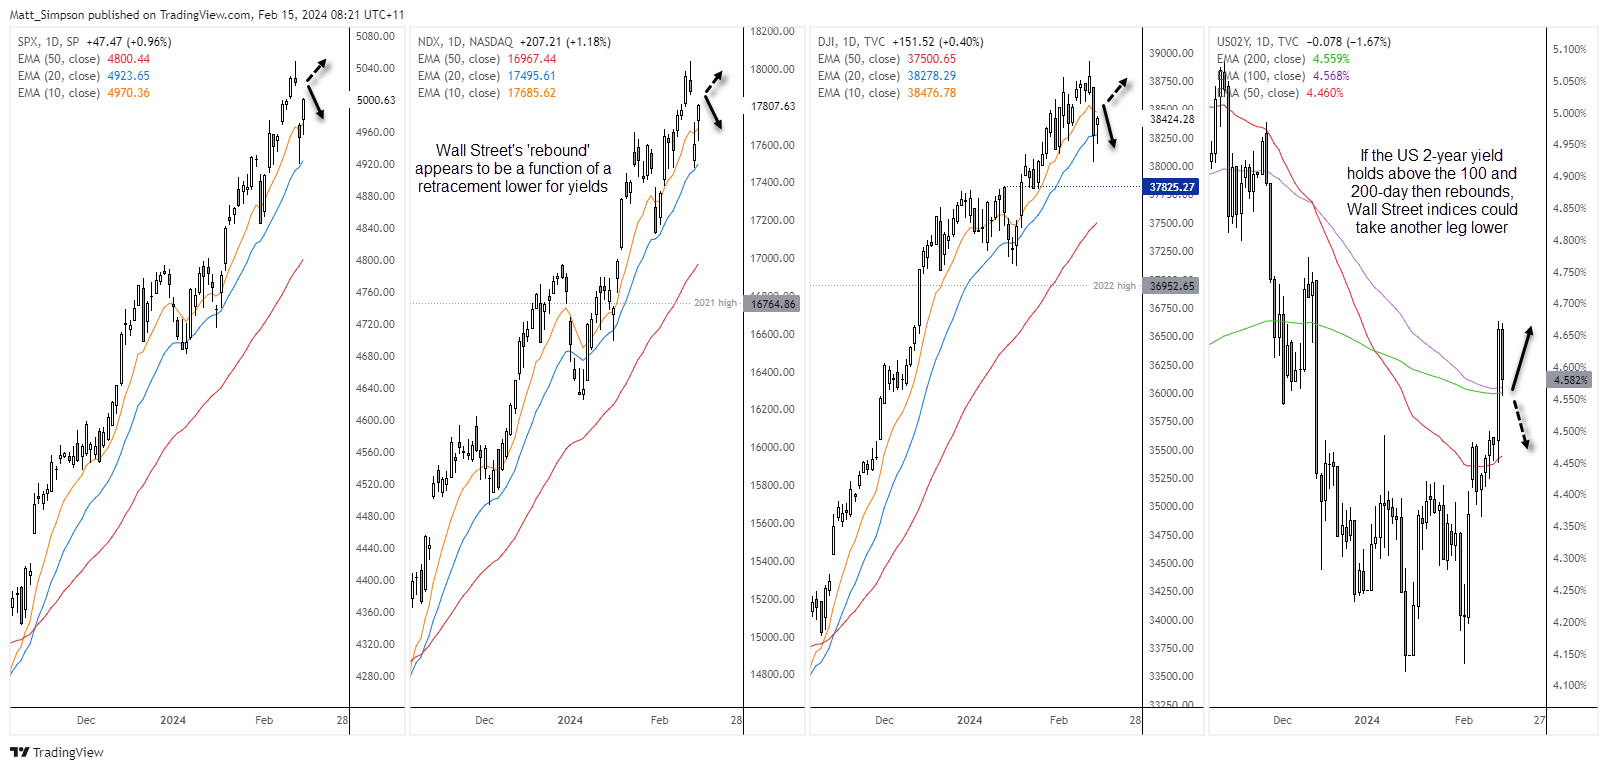
Nasdaq 100, Dow Jones, S&P 500, US-year yield daily chart:
The US 2-year has retraced back to its 100 and 200-day EMAs, and whether it rebounds from this pivotal level or hands back the remainder of Tuesday’s gains could be the difference between Wall Street falling further or retesting its highs. Yes, US indices rose on Wednesday, yet they only recouped around half of Tuesday’s gap lower. If yields rally from here, US indices could struggle to fill those gaps and take another leg lower. Yields are in the driving seat.
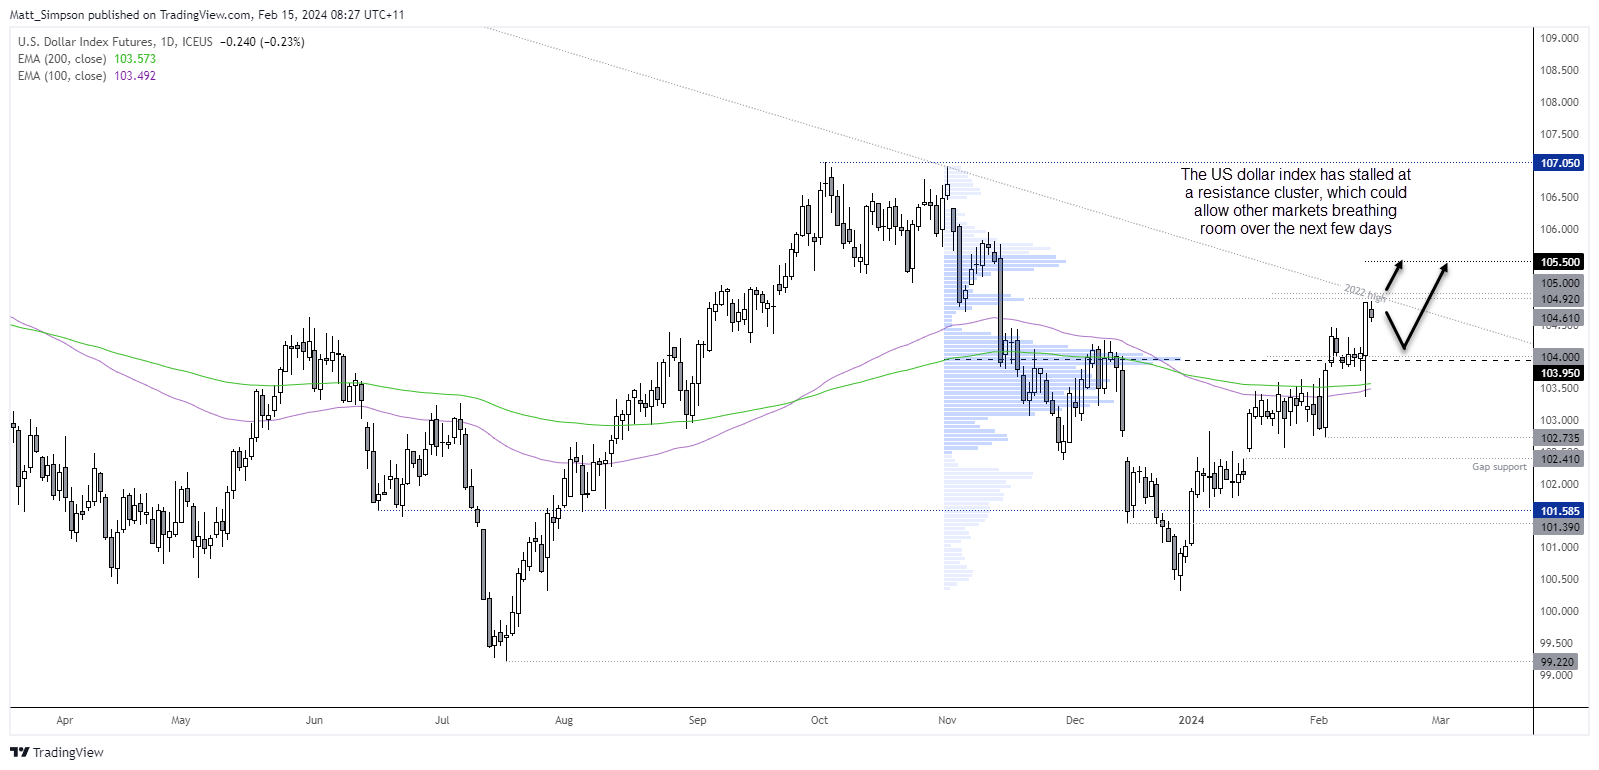
US dollar index:
The US dollar index predictably stalled just below 105, near a resistance cluster which includes trend resistance from the 2022 high. And that allowed AUD/USD and NZD/USD to lead the pack on an apparent relief rally as they tracked Wall Street indices higher. What makes me suspect that we could be in for a choppy few days is that we’ve likely seen the most volatile day of the week, and markets are now looking for their next cue whilst traders decide whether yields will rebound and take the US dollar above 105. And if they do, that could see USD/JPY head for the BOJ intervention highs, just below 152.
Events in focus (AEDT):
The focus now shifts to Australia’s employment report, where I’m keen to see if it reveals another mass culling of full-time jobs. The -106k full-time jobs lost in December was its third worst print on record, or worst in a non-recessionary period. And if further cracks appear in the jobs market, it could bring forward expectations of a dovish pivot by the RBA and see AUD/USD re-shift its focus on my 64c target.
- 08:45 – New Zealand electronic card retail sales, food price index
- 10:50 – Japan’s GDP
- 11:00 – Australian inflation expectations (Melbourne Institute)
- 11:30 – Australian employment report
- 15:30 – Japan’s industrial production
- 18:00 – UK GDP, industrial production, manufacturing production, trade balance, index of services
- 23:00 – ECB Lane speaks
View a preview for Australia’s employment report: AUD/USD, ASX 200 forward testing: Australian employment report
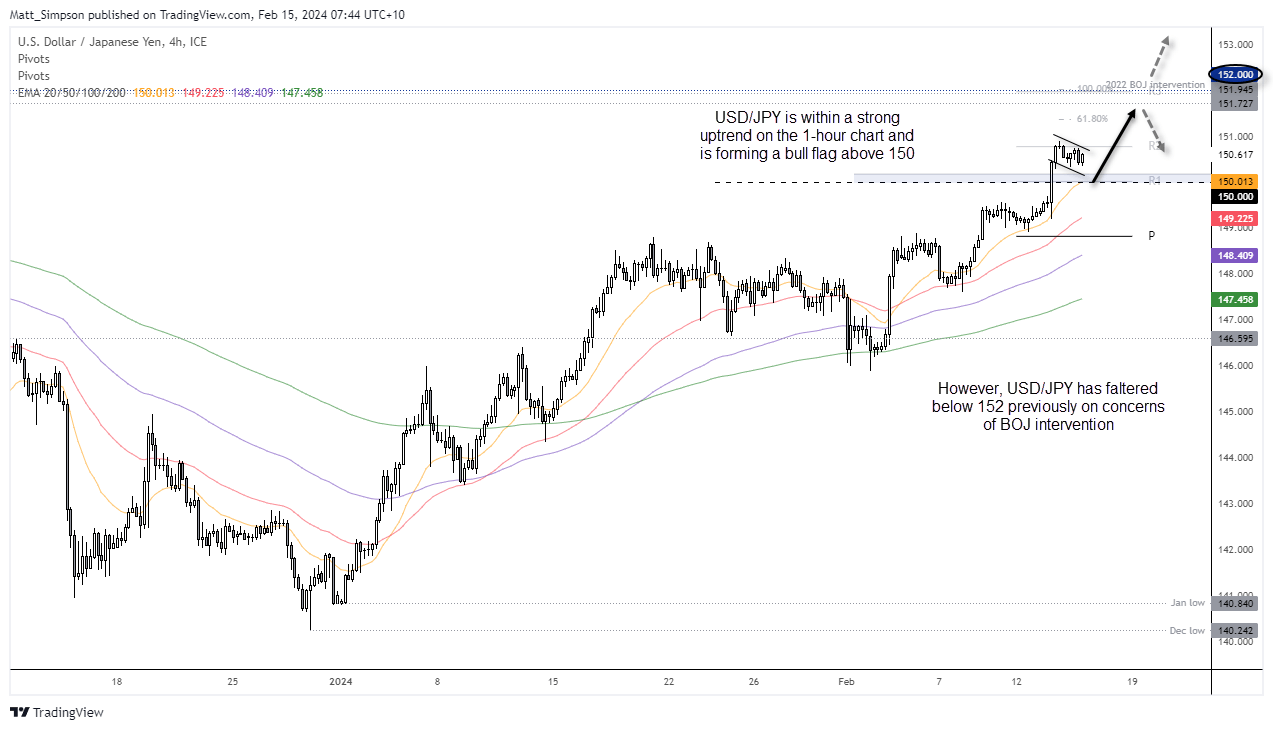
USD/JPY technical analysis:
USD/JPY remains in a strong uptrend on the 1-hour chart. Prices are holding above 150 and forming a potential bull flag, which projects an upside target around the BOJ intervention highs. As I expect 150 to hold as support (but allow some wriggle room) then retracements towards this level could be appealing to dip buyers.
Of course, there are risks that the BOJ become more verbal the closer it gets to the 152 handle – a level it has faltered at due to BOJ intervention of market-driven fears of one coming. And if the yen weakens too quickly, the odds of verbal intervention rise. But until then, the uptrend remain in force and the bias for a bull-flag breakout are favoured.
View the full economic calendar
-- Written by Matt Simpson
Follow Matt on Twitter @cLeverEdge
How to trade with City Index
You can trade with City Index by following these four easy steps:
-
Open an account, or log in if you’re already a customer
• Open an account in the UK
• Open an account in Australia
• Open an account in Singapore
- Search for the market you want to trade in our award-winning platform
- Choose your position and size, and your stop and limit levels
- Place the trade
Latest market news
Yesterday 01:32 PM
Yesterday 09:35 AM
Yesterday 07:23 AM
Yesterday 04:48 AM
Yesterday 12:17 AM
July 25, 2024 10:39 PM
Latest Asian Open articles

July 25, 2024 10:39 PM

July 24, 2024 10:10 PM

July 23, 2024 11:29 PM

July 22, 2024 10:43 PM