


US index futures turned positive by mid-day in London after being lower earlier. Wall Street had closed in the positive territory on Monday, albeit well off the earlier highs. European indices also struggled for direction after a strong performance on the first day of the week. There was very little in the way of fresh news to provide direction. Despite the relative calm and firmer European markets, the risks remain skewed to the downside for US indices. In short, all because of rising bond yields.
Why are US markets struggling for direction?
Investors are understandably cautious to invest money into the markets, given the cost-of-living crisis around the world and the stickiness of inflation. While we have seen signs of peak inflation and the economy has held its own better than hoped, rising bond yields continue to pose a big threat to stocks and other risk assets.
Last week saw the S&P 500 drop 2.7% and thus suffered its biggest weekly fall of the year. This makes Monday’s bounce suspicious as it could prove to be a bull trap. The drop in US equity prices last week coincided with global bond yields going in the opposite direction, closing higher for the 4th straight week. We have seen mostly stronger-than-expected inflation and other macroeconomic indicators in recent weeks. The market was always going to re-price its projections of US interest rates higher, and this is precisely what has happened. The Fed is no longer seen pausing its rate-hiking cycle as soon as the conclusion of the central bank’s March meeting, which is what the market had previously anticipated.
According to the CME’s FedWatch tool, the market is now pricing in at least a 25-basis point rate hike for March, with the odds of a 50-bps hike rising to about 25% form zero a month ago. This would be the second hike of 2023. Another rate hike with similar probabilities is priced in for the subsequent meeting, in May. Yet, a fourth hike is also pencilled in for June.
Unsurprisingly, yields have correspondingly risen with those on the benchmark US 10-year bonds closing in on 4%, a level not seen since last autumn.
US stocks too expensive relative to bonds for yield-seekers
Now, with yields on the rise again, this has weighed on the S&P 500’s so-called equity risk-premium (ERP). This measures the potential reward investors might reap from buying US stocks, above and beyond a “risk-free” asset – namely US bonds. Without getting too geeky about it, the equity risk premium is usually calculated as the expected stock market return (S&P’s earnings per share over the next year, divided by index level) minus “risk free” rate (i.e., yield on US 10-year bonds). Anyway, the ERP on S&P stood at just 1.7% on Friday, its lowest level since 2007.
Given the elevated macro risks and a low equity risk-premium (ERP), many investors would rather avoid all the headache and buy short-dated Treasurys to earn a fixed, higher, return of around 5% or so. This is precisely what has also weighed on non-interest-bearing assets like gold and silver, as well as highly speculative assets such as cryptos, of late. Yet, the US equity markets have remained relatively resilient. Undoubtedly, there are other factors at play. A low ERP does not mean all stocks are bad. It just means investors will have to be very selective in picking the right stock and remaining nimble.
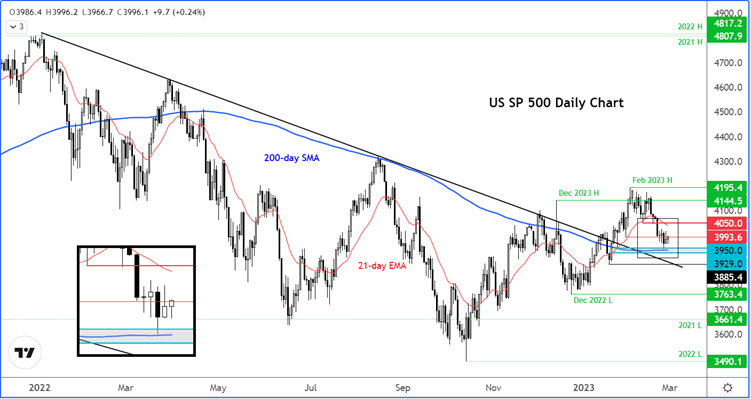
S&P 500 technical analysis
The S&P 500 remains inside a large chop zone, with both the bulls and bears seemingly having success with the “hit-and-run” type of trades. It is yet unclear whether the bearish trend that began in 2022 has now resumed. The S&P has bounced right where it needed to: around 3929-3950. This is the base of the previous breakout and corresponds with the 200-day average. Yet, many short-term support levels have already broken such as 3994 and 4050. These levels must be reclaimed on a daily closing basis before the bulls become confident that the market wants to push higher. Unless that happens, I think the risks remain skewed to the downside despite the recovery. For confirmation, a clean move below the abovementioned support area would confirm the bearish reversal.
-- Written by Fawad Razaqzada, Market Analyst
Follow Fawad on Twitter @Trader_F_R
How to trade with City Index
You can trade with City Index by following these four easy steps:
-
Open an account, or log in if you’re already a customer
• Open an account in the UK
• Open an account in Australia
• Open an account in Singapore
- Search for the company you want to trade in our award-winning platform
- Choose your position and size, and your stop and limit levels
- Place the trade
Latest market news
Yesterday 01:32 PM
Yesterday 09:35 AM
Yesterday 07:23 AM
Yesterday 04:48 AM
Yesterday 12:17 AM
July 25, 2024 10:39 PM
Latest Stocks articles

July 18, 2024 11:35 AM

June 13, 2024 02:00 PM

June 6, 2024 02:00 PM
June 2, 2024 08:00 AM