


Medium-term technical outlook on Goldman Sachs (GS)
click to enlarge charts
Key Levels (1 to 3 weeks)
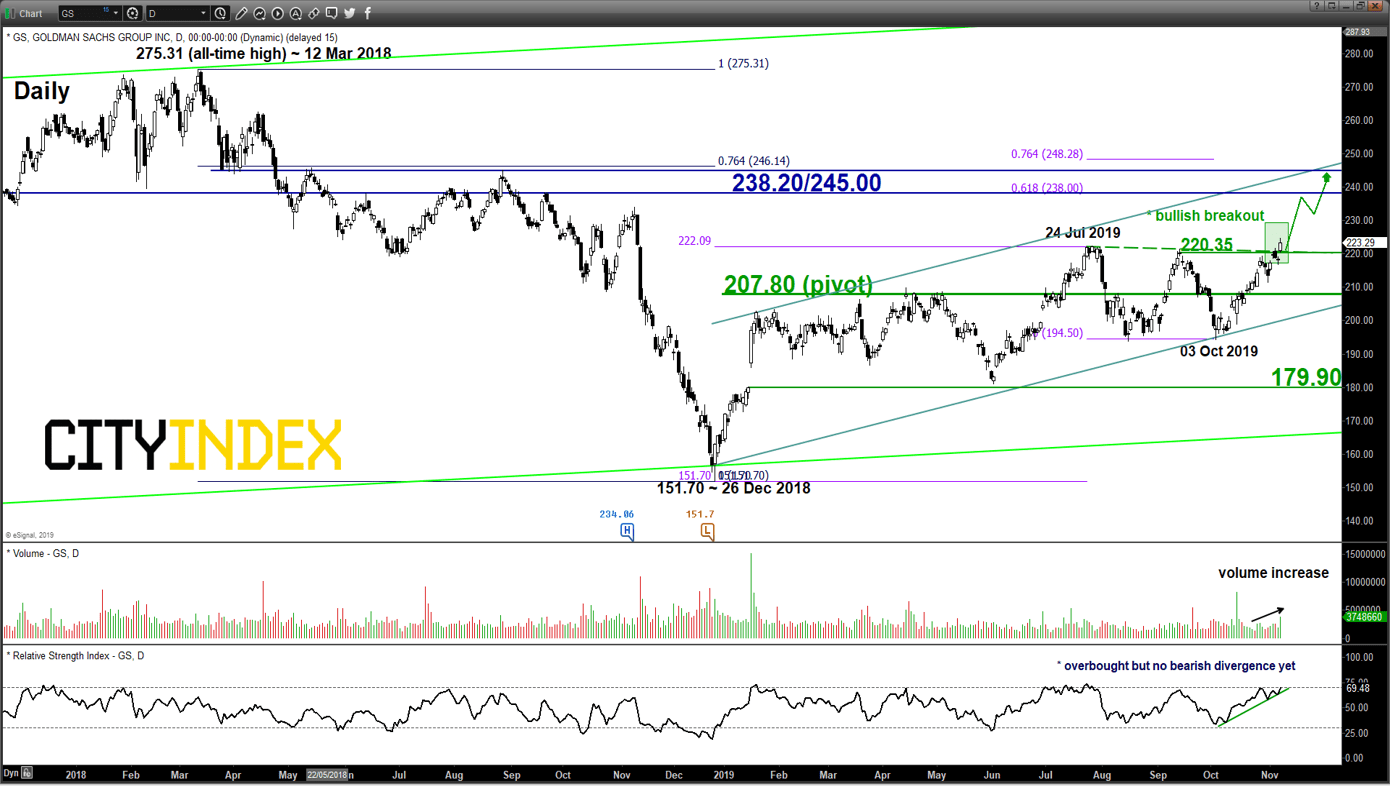
Intermediate support: 220.35
Pivot (key support): 207.80
Resistances: 238.20 & 245.00
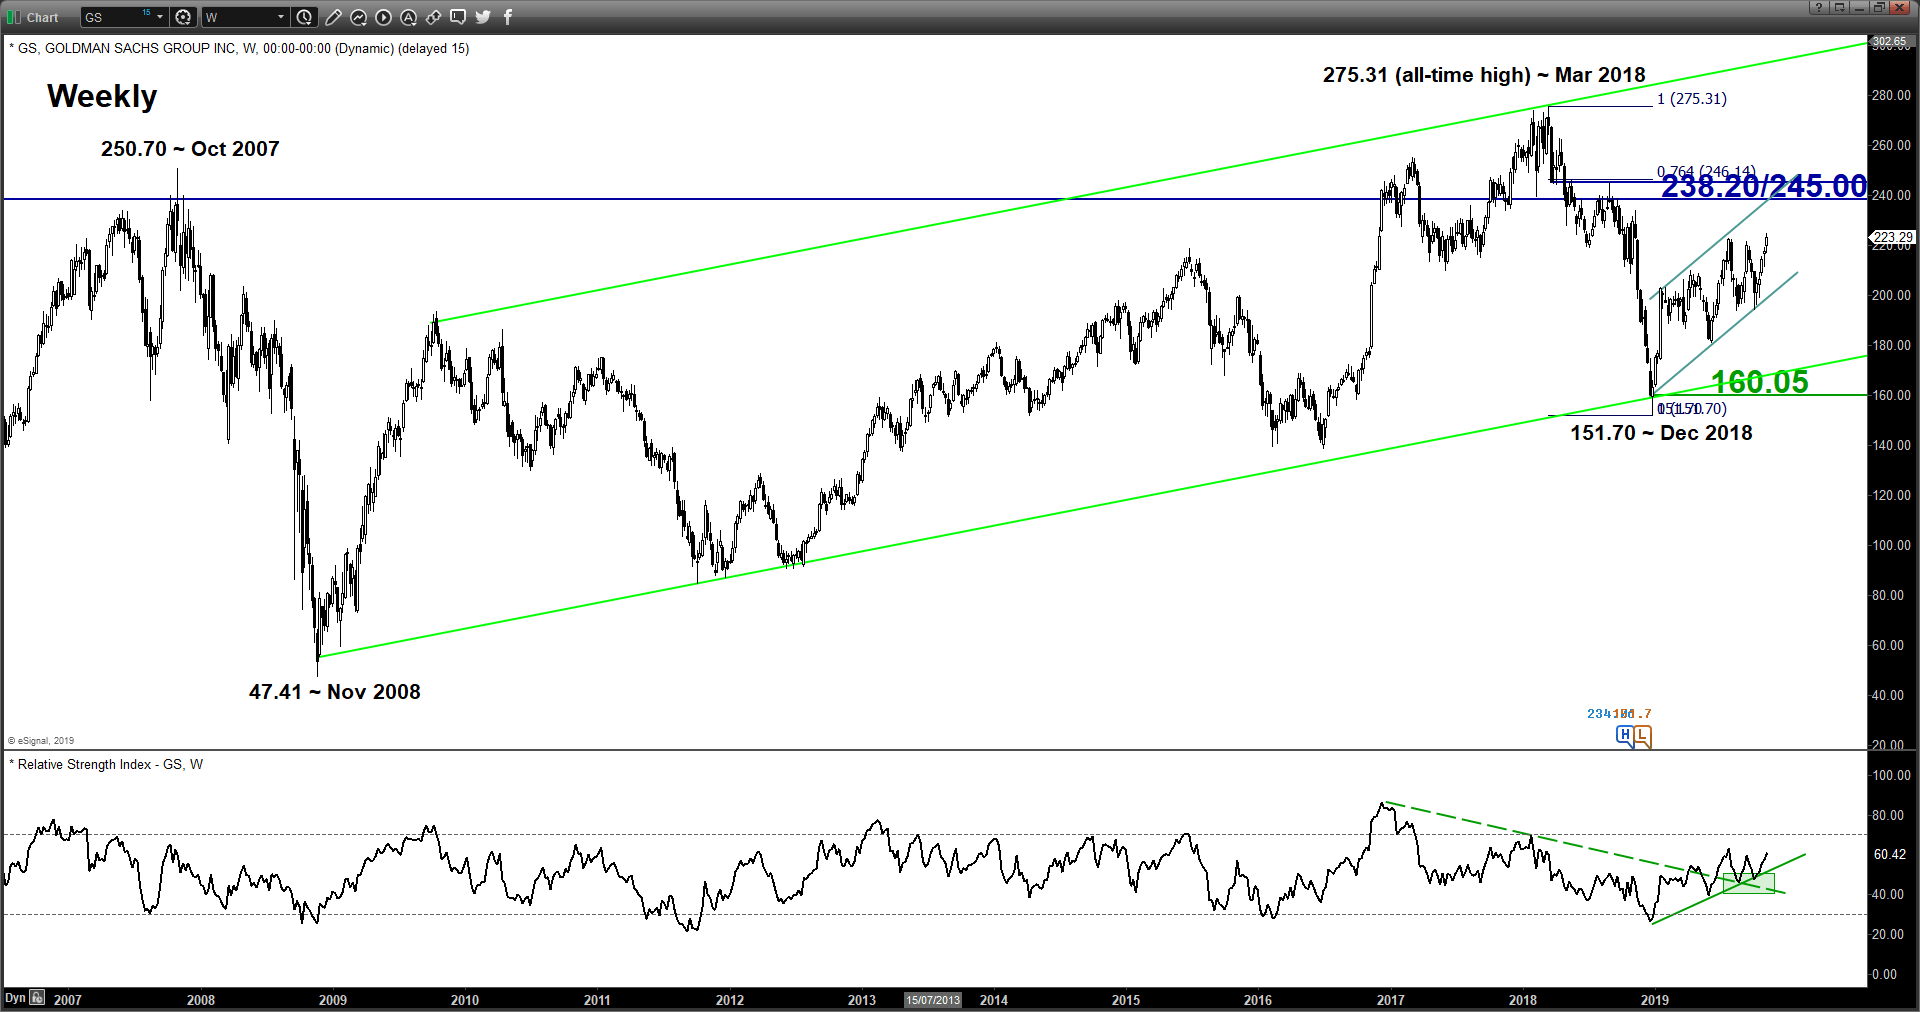
Next supports: 179.90 & 160.05
Directional Bias (1 to 3 weeks)
Bullish bias above 207.80 key medium-term pivotal support for a further potential upleg to target the next resistances at 238.20 follow by 245.00 next.
However, a break with a daily close below 207.80 invalidates the bullish scenario for another round of corrective decline sequence within its long-term secular uptrend phase in place since Nov 2008 low for a drop towards the next support at 179.90 (the swing low area of 03 Jun 2019 & 61.8% Fibonacci retracement of the up move from 26 Dec 2018 low to 07 Nov 2019 high).
Key elements
- GS has staged a bullish breakout yesterday, 08 Nov from a 3-month sideways range configuration in place since 24 Jul 2019 high with a relatively high-volume reading.
- The weekly & daily RSI oscillators have continued to evolve in positive configurations which suggest medium-term upside medium remains intact.
- The significant medium-term resistance zone of 238.20/245.00 is defined by a swing high area of 14 May/28 Aug 2018, a Fibonacci retracement/expansion cluster and the upper boundary of a major ascending channel from 26 Dec 2018 low).
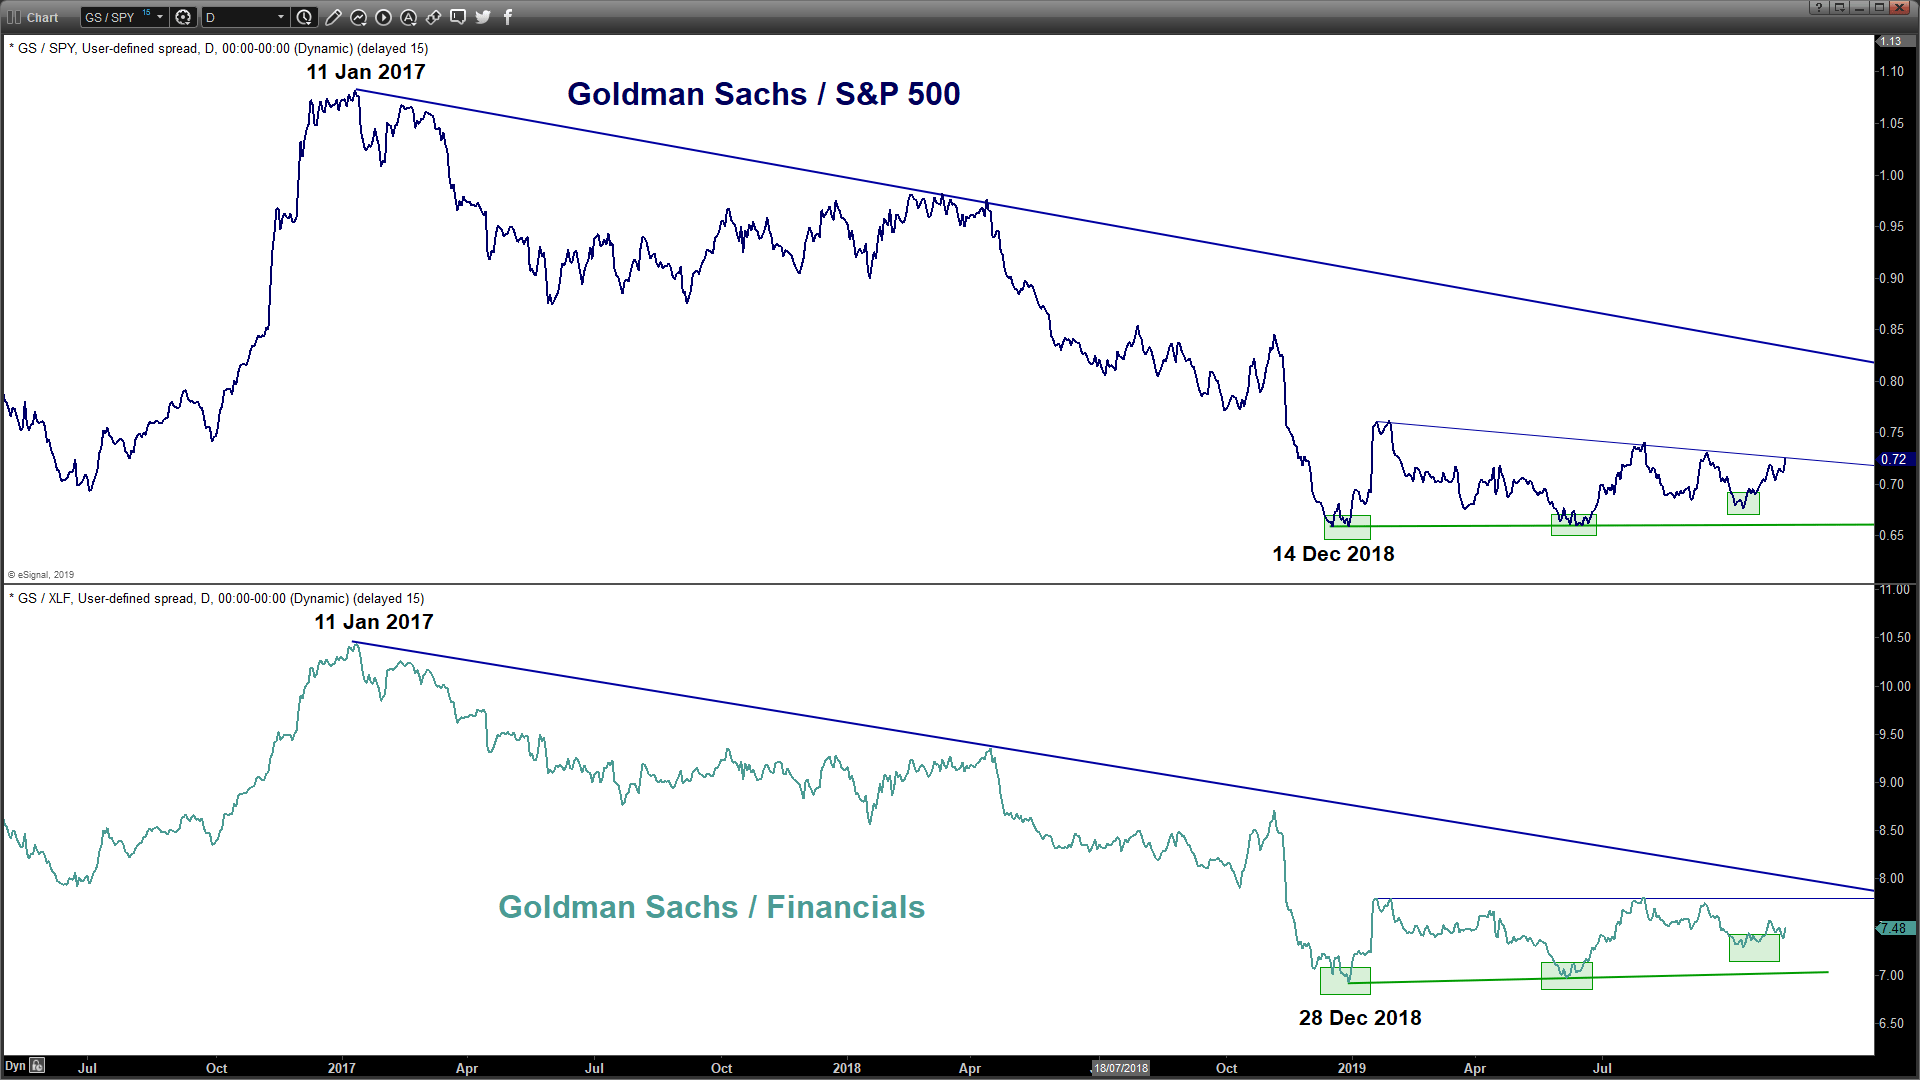
- Relative strength analysis from the ratio charts of GS against the market (S&P 500) and its sector (Financials) are showing “bottoming” formations. These observations suggest an impending potential outperformance of GS after underperforming both the S&P 500 and Financials sector for almost 10 months.
Charts are from eSignal
Latest market news
April 25, 2024 03:09 PM
April 25, 2024 03:00 PM
April 25, 2024 01:12 PM
Latest Bank Stocks articles

October 10, 2023 09:31 AM

October 6, 2023 02:28 PM

July 17, 2023 04:03 PM

July 11, 2023 02:28 PM