are chinese stocks due a rebound 1669682015
The sell-off in Chinese stocks in recent weeks makes the volatility in European and US indices look like a walk in the park. For example, […]


The sell-off in Chinese stocks in recent weeks makes the volatility in European and US indices look like a walk in the park. For example, […]
The sell-off in Chinese stocks in recent weeks makes the volatility in European and US indices look like a walk in the park. For example, the volatility in the Dax rose to a high of 35 last week, ahead of the Greek referendum. In contrast, volatility in the Shanghai Composite index was double that, peaking at 70 earlier this week.
Chinese volatility at extreme levels:
To put this into some context, the Vix index, which measures volatility in the S&P 500 spiked briefly to 90 on the back of the Lehman Brothers bankruptcy and the near collapse of the Western financial system. China is still growing at 7% per annum and there have been no events comparable to the 2008 credit crunch, so what is going on?
The volatility in the Shanghai Composite is close to its highest ever level. The last time Chinese equity vol was at this level was back in 2008, as you can see in the chart below. Back then, when volatility spiked to 77.5 it corresponded with the bottom of the market. While history does not always repeat itself, we would be very wary of further declines in Chinese stocks after this sharp sell-off, and they could be due a rebound.
Typically when volatility spikes it does not stay at elevated levels for long since bargain hunters come back into the market, supporting prices and precipitating a rebound. The Shanghai Composite is a different beast from the S&P 500 and European indices for a couple of reasons: 1, it is mostly traded by retail traders (other indices are dominated by institutional investors), and 2, it is immature compared to other markets and thus does not walk to the beat of the same drum as the S&P 500, the FTSE 100, Dax etc, however we believe that it will be tough for volatility to stay this elevated for such a long time.
Since volatility and price tend to have a negative correlation, if volatility in the Shanghai Composite retreats in the coming days then we could see price embark on a recovery period.
The technical view:
A recovery in Chinese stocks also corresponds with some technical indicators. The Shanghai Composite is testing a critical level of support – the 200-day sma. If the market respects this level then it could limit further downside for Chinese shares, at least in the short term.
The Shanghai Composite has retraced more than 50% of its rally over the past 12 months in less than a month, which equates to a drop of 1,671 points. In the event of a recovery in Chinese shares then key resistance levels to watch out for include:
Of course, the index could sell off even further, though we think this is unlikely in the short-term due to fundamental (PBOC intervention) and technical (200-day sma support and vol levels) factors. If we do see a further sell off then 3,250 comes into view as key support, which is the 61.8% retracement of the same rally.
Takeaway:
Figure 1:
Shanghai Composite: price (yellow) and volatility (white)
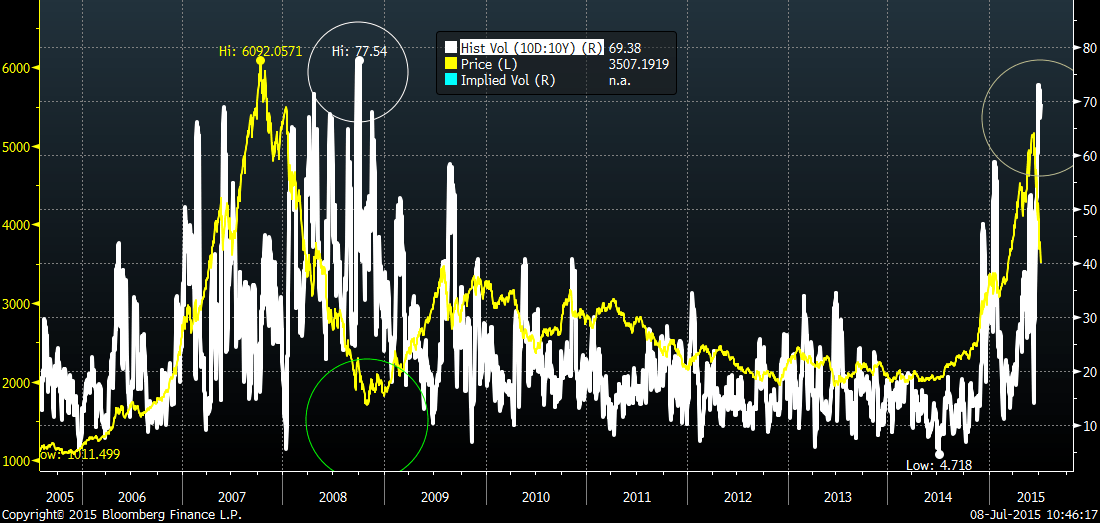
Source: FOREX.com, Data: Bloomberg
Figure 2:
Shanghai composite with key support levels marked
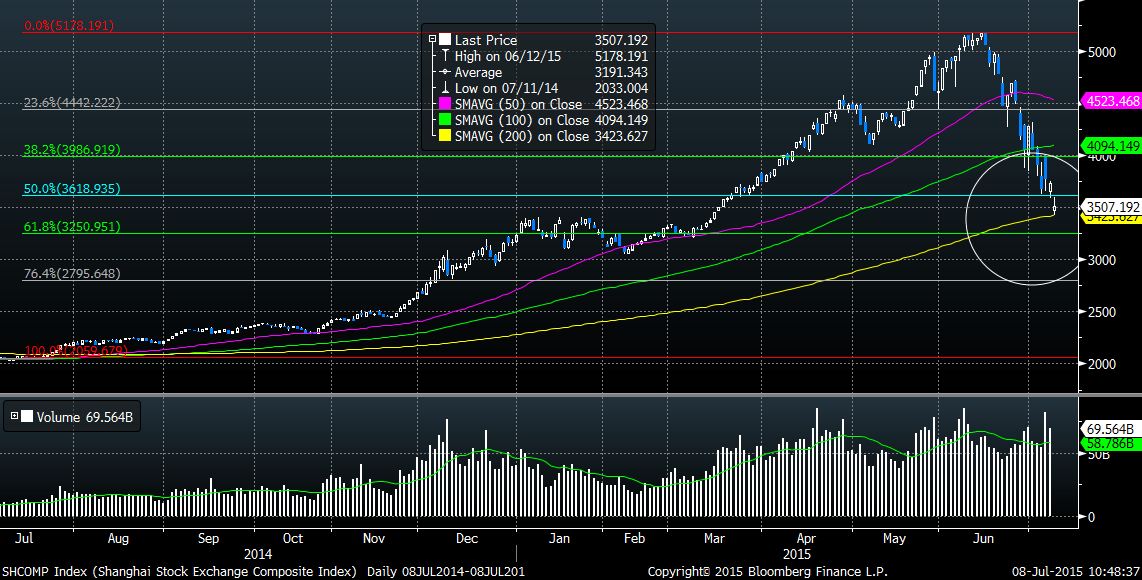
Source: FOREX.com, Data: Bloomberg