

One of the biggest storylines from last month was the wild swings we saw in one of the planet’s most fundamental commodities, crude oil. Looking at spot WTI (USOIL), prices traced out the following path in March:
- Started the month with a surge of more than +33% in a little more than a week…
- …then fell by more than 25% into the middle of the month before…
- …Tacking on another nearly 25% through the 24thand…
- …Finally falling by 15% from those highs to close last week.
In other words, oil saw a year’s worth of volatility in just a month’s time!
Notably, each of those subsequent moves were smaller in magnitude than the previous swing, creating a series of lower highs and higher lows on the chart. In traditional technical analysis parlance, oil carved out a well-defined “symmetrical triangle pattern” across the month of March. For the uninitiated, a common analogy for this pattern is that of a spring being compressed from both the top and the bottom; it builds up potential energy and once one of those pressure points is removed, the spring (WTI price) is likely to move sharply in that direction.
As the chart below shows, the symmetrical triangle is approaching its apex, raising the probability of a high-volatility breakout in the coming days.
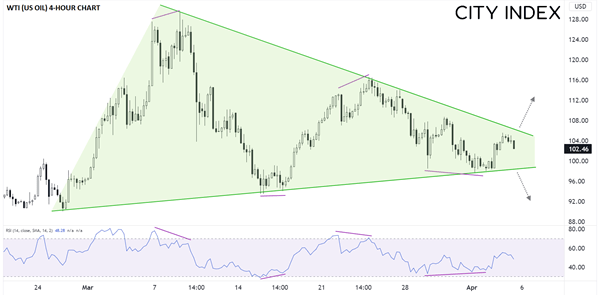
Source: TradingView, StoneX
Astute traders will also note that prices formed a bearish divergence with the 14-period RSI before reversing on all four occasions last month; accordingly, if we don’t see a similar divergence on a breakout beyond the triangle pattern, it would add even more confidence in a continuation in one direction or the other.
In terms of logical target areas, a bullish breakout would initially pave the way for a move up to the late-March high near $116, while a bearish breakdown could fall to the late February lows near $90.00 in short order.
How to trade with City Index
You can trade with City Index by following these four easy steps:
-
Open an account, or log in if you’re already a customer
• Open an account in the UK
• Open an account in Australia
• Open an account in Singapore
- Search for the company you want to trade in our award-winning platform
- Choose your position and size, and your stop and limit levels
- Place the trade
Latest market news
Yesterday 01:32 PM
Yesterday 09:35 AM
Yesterday 07:23 AM
Yesterday 04:48 AM
Yesterday 12:17 AM
July 25, 2024 10:39 PM
Latest Oil articles

July 24, 2024 09:55 AM
July 21, 2024 01:00 PM

July 19, 2024 01:23 PM

July 18, 2024 01:12 PM