Week Ahead the US election is finally here
Overview of the US election and its impact on the global economic outlook US stocks: what could do well/ do badly under a Trump or […]
Overview of the US election and its impact on the global economic outlook US stocks: what could do well/ do badly under a Trump or […]
1. Too close to call: why global markets shudder at US election risks
The markets are starting to get jittery as the world’s most important election this year is finally upon us. While it seemed like a clear win for the Democrats and Hillary Clinton one week ago, now the polls have narrowed and Trump could do what seemed impossible just days ago, and steal victory from under Hillary Clinton’s nose. This makes this election so exciting from the perspective of financial markets, and we expect to see a surge in volatility this week.
Volatility is likely to be the key feature of the remaining days of this election cycle. After remaining subdued in the run-up to the vote, the Vix index, also considered Wall Street’s fear gauge, started to move higher last week, which coincided with a sell off in global stock markets. The Mexican peso, which has been a lightening rod for Donald Trump’s election prospects in recent months, has also come under pressure as a win for Trump could see the US/ Mexican trade relationship crumble.
Historical election upsets and what they do to stocks
Although the markets still consider Clinton the likely winner this week, after all she has a large lead in the critical electoral college votes compared to Trump, there have been upsets before. Way back in 1948, Republican Thomas Dewey was expected to win the Presidential race, only to lose to incumbent Harry Truman. This shock result triggered a 10% fall in the S&P 500 over the next 2 weeks’. (We thank Capital Economics for doing this analysis). Considering Truman was already President, could an unconventional, novice like Trump trigger an even deeper sell-off in the S&P 500 if he beats Hillary Clinton this week? We think there is a good chance that he could.
Perhaps the biggest risk from this election would actually be a result that is too close to call, or a contested victory that would need to go to the Supreme Court. The last time this happened was in 2000 between Al Gore and George W Bush. Ultimately Bush was declared the victor, after a recount in the key swing state of Florida. The final result was not called until December, a month after the actual election. The uncertainty about who had won the election back in 2000 triggered a 5% sell off in the S&P 500 in the week after the election. But in a similar situation this time, the sell off could be sharper. When Bush was declared the winner, Gore immediately conceded, which calmed US stock markets. However, as relations between Clinton and Trump appear to get more toxic by the day, any delay to a candidate conceding the election could add to the downward pressure on risk assets and trigger a deeper sell off in risk assets compared to what we saw in 2000, in our view.
Under this scenario we would expect that a rate hike from the Federal Reserve would be immediately off the cards. After Tuesday’s election we have a raft of Fed speakers, we expect them to give financial markets a steer on where the Fed stands post the result, and whether or not we should expect a rate hike next month. Considering the financial markets are pricing in a 70% chance of a hike, if it starts to look like the Fed will not cut rates on the back of the US election result, then we would expect to see a rapid re-pricing of US asset prices, including a sharp decline in US Treasury yields and the US dollar. It may also trigger a slight boost for US equities, as borrowing costs would stay low for longer, however the extent of the boost for stocks would depend on the political landscape, a hostile landscape would be bad news for US equities regardless of whether the Fed puts the brake on a rate hike.
Elsewhere in the world, the China CPI and export/ import data will be watched closely to see if the economy continues to recover. There is a host of Japanese data next week too. However, we think that domestic economic fundamentals are likely to take a backseat to US election risks this week, especially for the yen, but also more broadly for Asian asset prices, which are likely to be very sensitive to the US election in the coming days.
2. US stocks outlook: Five stocks to sell on a Clinton win, five to dump if Trump wins:
But first, five reasons why presidential-election related stocks to buy/sell are a waste of time
That said we still believe these exercises can be worthwhile because they make us think about the big picture policies that both candidates might bring to the table if they win and which could therefore have an impact on the stock market.
Conversely, which ever candidate loses,, forfeits the right to exert their will on the law-making process. By default, the absence of the views they would have brought to the Oval office will delight some investors whilst putting others off.
Broadly speaking, the risk of a Donald Trump presidency is perceived to centre on ‘protectionist’ trade policies, which purport to favour American labour above workers in other countries, to put the view in the simplistic way that it is often presented.
For Hillary Clinton, the sector which has most to fear might be the pharmaceutical and healthcare sectors given her repeated mentions of allegedly predatory pricing by ‘Big Pharma’.
However, the waters have been muddied in recent months, given that her opponent’s views on trade appeared to have forced Clinton to harden her own views on the subject. She has for instance changed her view on the Trans-Pacific Partnership, having initially been supportive.
Pharma groups already facing operational challenges come into view in light of Clinton’s intention to clamp down on pricing, pointing to shares like Allergan and Mylan. However investors will also reach for the biggest pharmaceutical makers like Bristol Myers-Squibb, Merck & Co.
Additionally, among the year’s worst performers in the sector, Mallinckrodt, can expect little respite in the event sentiment on the industry weakens.
On the bearish side for a Trump victory, our view is that stocks from industries that could be negatively impacted should U.S. trade policy turn more ‘protectionist’ will be in focus. The group occupies 3 ‘sub-spheres’, ‘Global Trade’, ‘Outsourcers’, and ‘US Importers’. Among the largest in these categories, FedEx, Boeing, General Electric, Ford, and Wal-Mart will be considered.
3. US indices outlook: US shares looking for a floor nearby
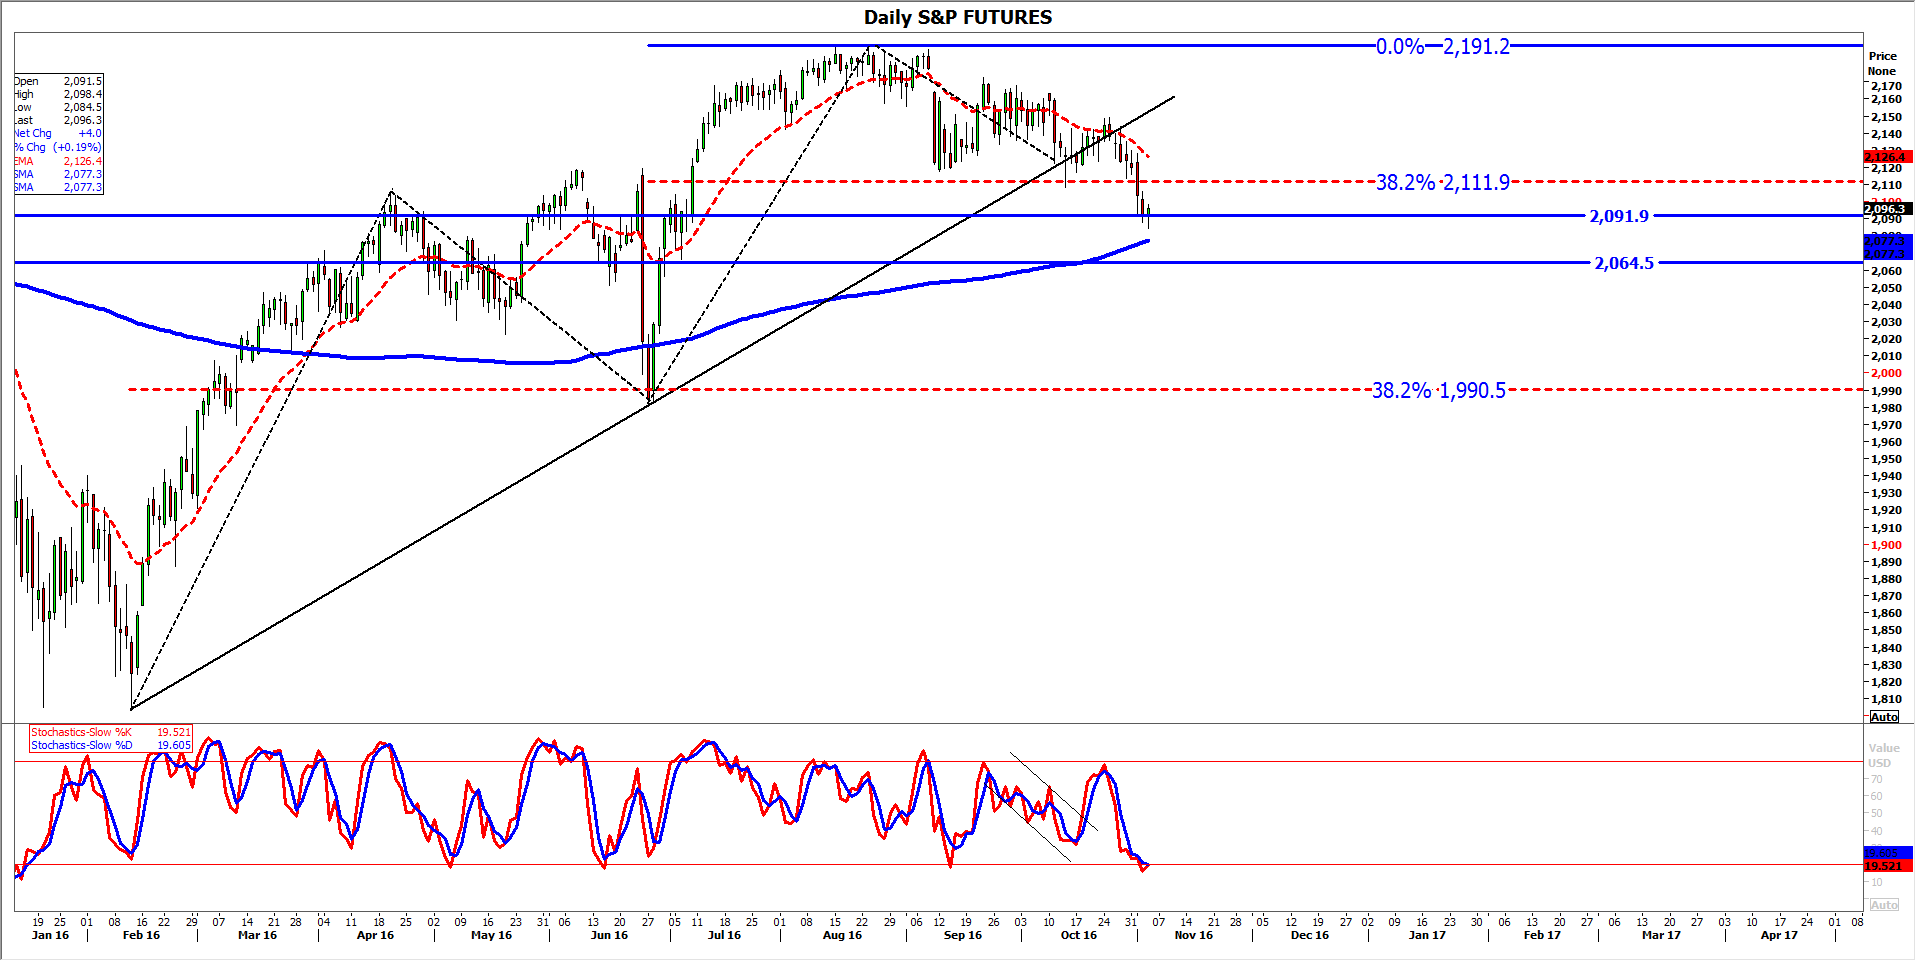
The S&P 500 is now on course for its longest losing streak since 2008, in the wake of news late last week that the FBI was reopening its ‘emailgate’ enquiry.
Hopes that the index would bounce at a closely watched support comprised of a 38.2% retracement of its most recent strong up-leg have proved to be forlorn.
In fact looking at the chart for the most liquid, tradeable derivative of the benchmark, its futures contract, the market has overshot and is now eyeing the next likely support zone—2064-2091, where that last rising phase kicked off.
The VIX is exacerbating the picture.
Long dormant, the ‘fear gauge’ has recently sprung back into life, and this week tagged its 20 level, which many investors regard as the threshold for almost official market risk aversion.
The wider market’s advance/decline ratio is not helping either, given the 1:5 ratio notched earlier this week.
Investors this week have pointed to what looks to be a test of the index’s 200-day moving average as key.
The threshold, currently around 2077, has been gently pointing higher since June, and continues to do so, suggesting buying momentum would require longer to exhaust, regardless of the deepening reversal.
Should both the aforementioned support zone and moving average fail to support the market, a sharper fall—perhaps to at least this summer’s 1981 low—could be on the cards.
Source: City Index
4, US election commodities special: what next for gold
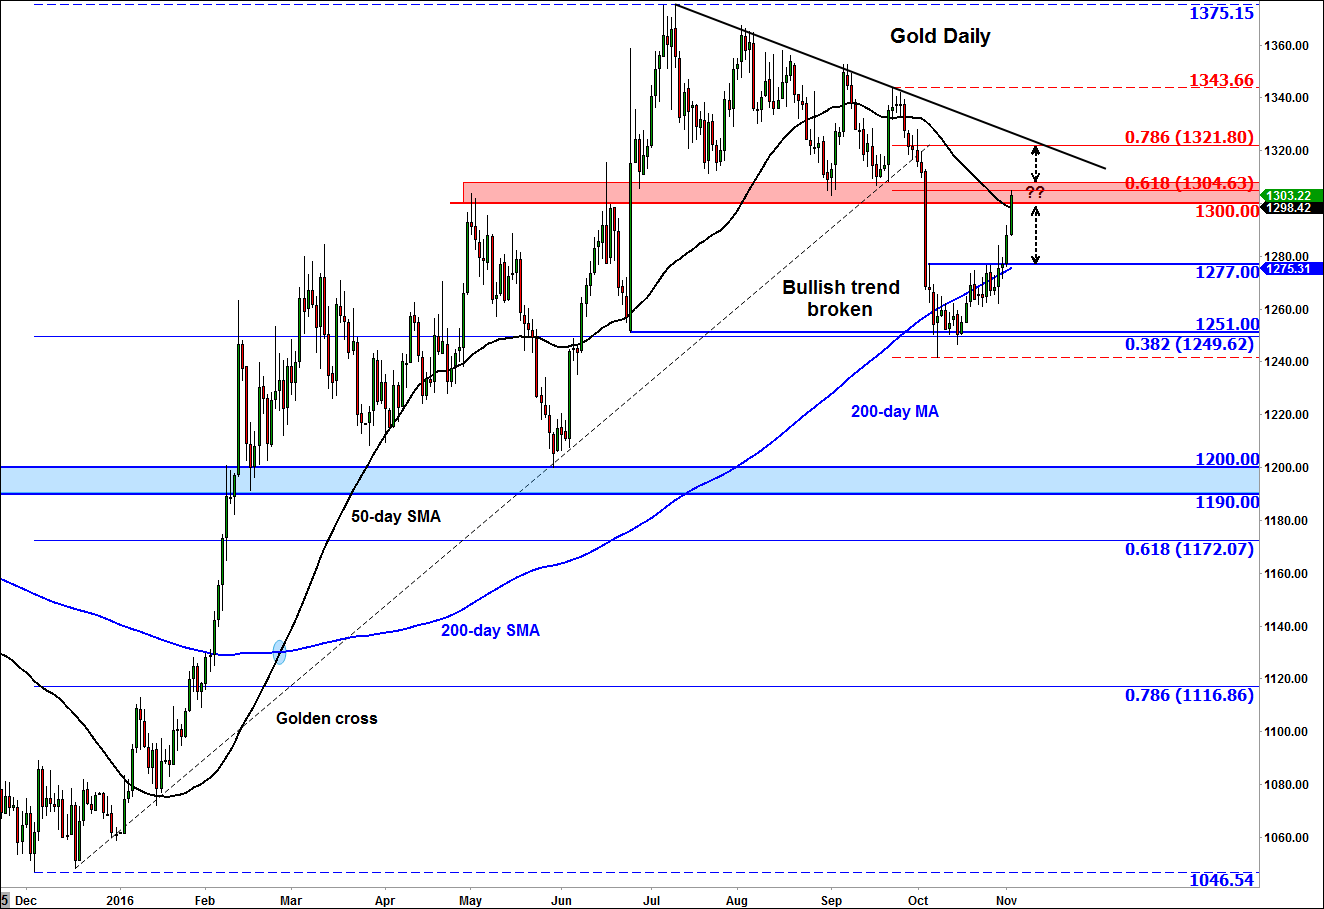
Thanks to increased uncertainty about the US elections and a drop in the dollar, buck-denominated gold has been surging higher in recent days to reach north of $1300 by Wednesday when this part of the report was written. The mild stock market sell-off had further supported the perceived safe-haven precious metal. However, the stay above $1300 could be short-lived as we believe the dollar could make a comeback should Hillary Clinton become the next US president. If that were to happen, the Fed will most likely raise rates in December before slowly tightening its policy further in the years ahead. Our underlying bullish fundamental view of the dollar makes us bearish on this buck-denominated and noninterest-bearing yellow precious metal.
On the technical front, the $1300/08 area for gold represents a major resistance zone. Previously, dips were bought here, now rips could be sold around this area. The 50-day moving average, which is now pointing lower, also comes into play in this zone, as does the 61.8% Fibonacci retracement level against the most recent high. There is a potential therefore for the sellers to return here and push gold back down towards the previous support at $1277 and if that level breaks potentially a lot lower over time. On the other hand, if the sellers do not show up around the $1300/08 area in a meaningful way then a continuation towards $1320/22 could be the outcome: here the 78.6% Fibonacci level converges with the bearish trend line.
Source: eSignal and City Index
5, US election FX special: key FX pairs to watch on election night
USD/MXN
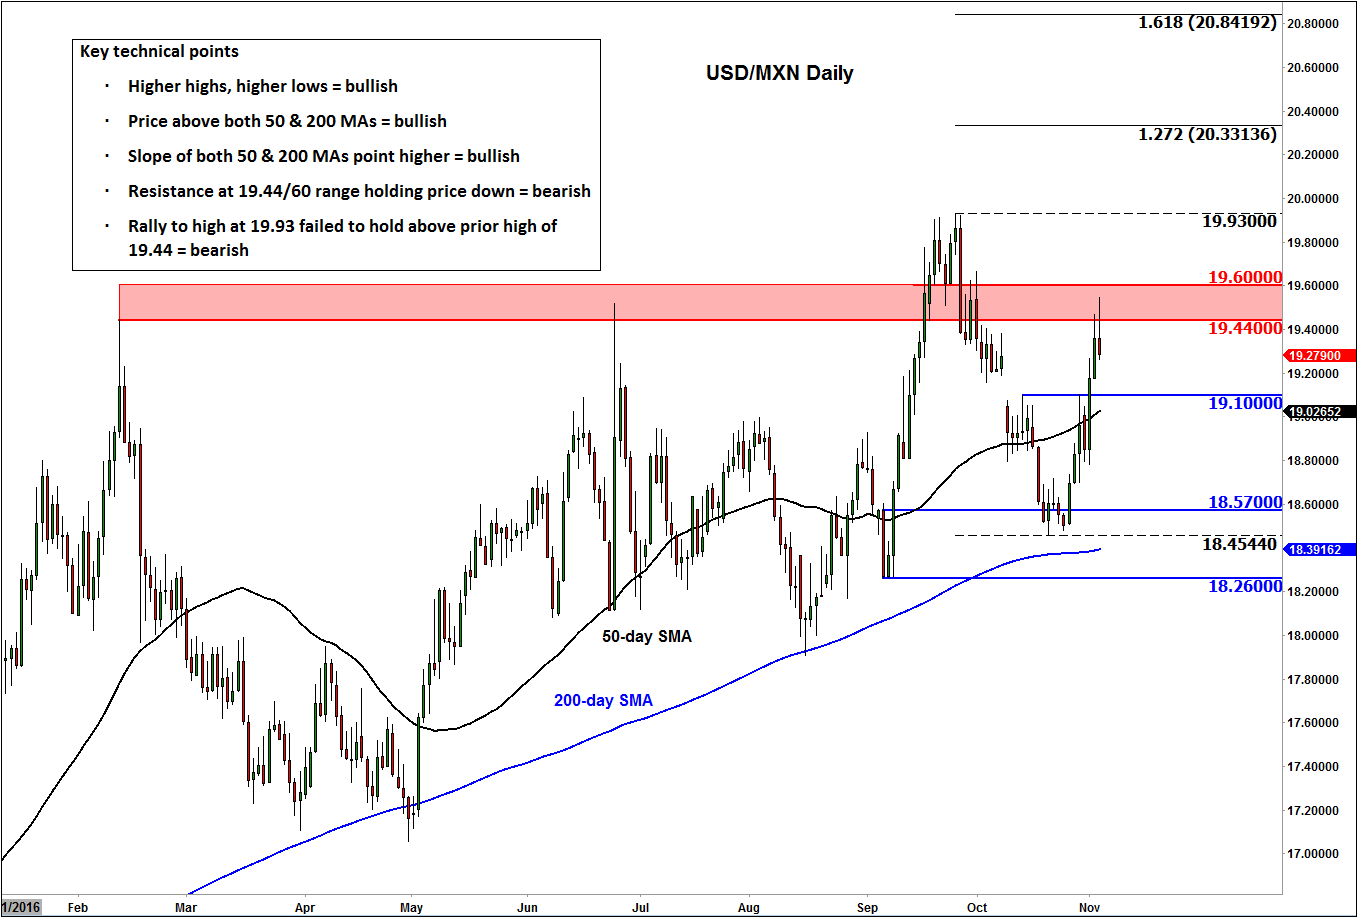
With the Mexican peso being inversely correlated with Donald Trump’s campaign performance in recent months (because of his hard-line positions on trade and immigration with respect to Mexico), the USD/MXN is our featured FX chart in this special US elections report. A potential Trump victory is widely expected to be negative for the peso, while a Clinton victory could lead to a relief rally for the embattled currency which could weigh heavily on the USD/MXN pair. The Key technical points to consider in this fundamentally-important time for this pair are as follows:
As noted above, there is no argument about the trend, which is bullish. Usually it is a good idea for traders to go with the trend. However given the elections uncertainty, now could be a good time for that trend to turn. Indeed, the recent technical indications are that the trend has started to point lower. This is clearly indicated by the fact that the most recent rally to the all-time high at 19.93 failed to hold above the prior high of around 19.44. The USD/MXN could now be in the process of forming its first lower high around this 19.44 area and below the next resistance at 19.60. A potential break below the previous low at 18.45 would result in the formation of the first lower low. Until and unless that happens, the long-term uptrend would remain intact. Some short-term support levels to watch are at 19.10, 18.57 and then that 18.45 prior low. If price moves below here, then the sellers could aim for the 200-day moving average at 18.39, followed by the next low at 18.26. Meanwhile on the upside, a break above 19.60 would expose the previous record high for a potential re-test. Further bullish objectives are the Fibonacci extension levels at 20.33 (127.2%) and 20.84 (161.8%).

Source: eSignal and City Index
EUR/USD
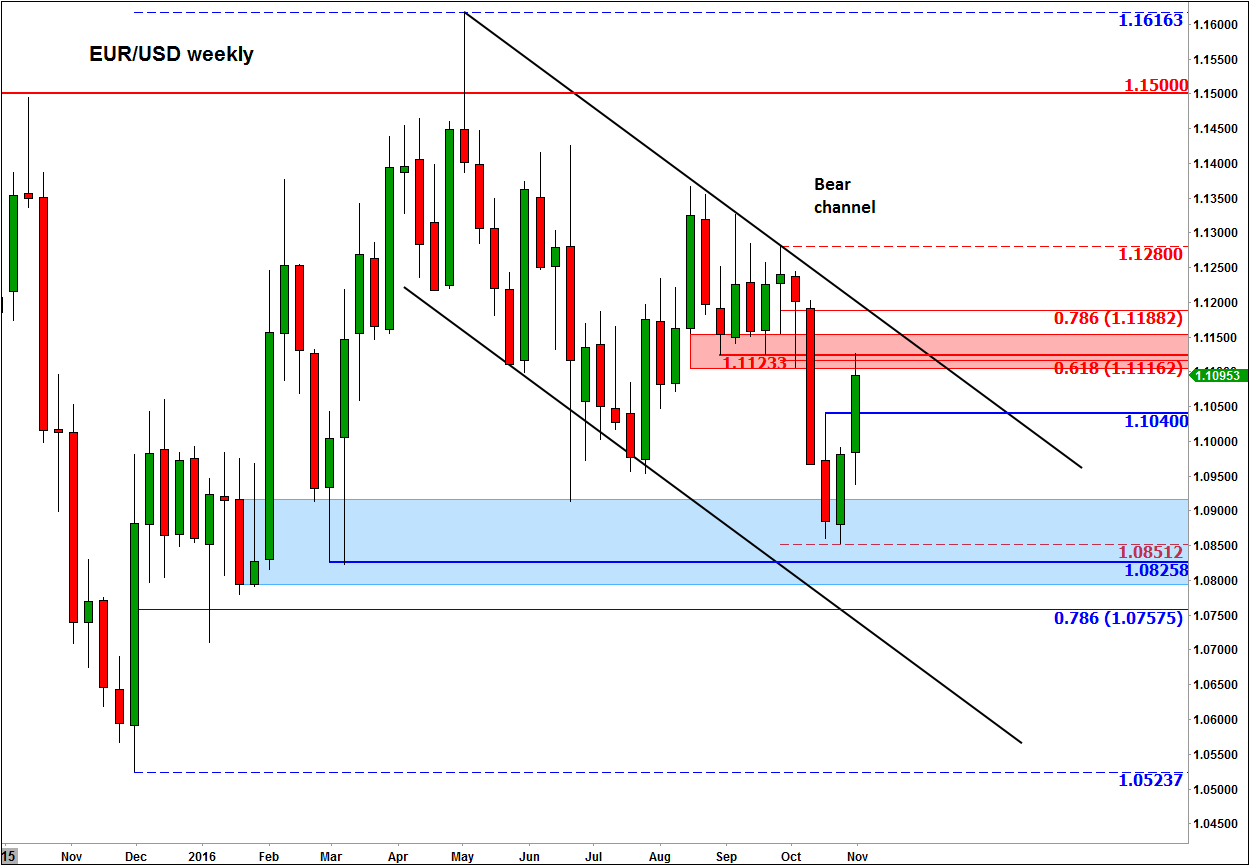
The EUR/USD’s short-squeeze rally could come to an end this week and more losses could be on the way next, unless Donald Trump scores a shock victory in the US presidential election race. The long-term weekly chart of the most heavily-traded currency pair shows that price has been making lower lows and lower highs inside its nearly two-year consolidation pattern. So, the medium-term trend is arguably still bearish. This week’s counter-trend rally to the prior key support, now resistance, at 1.1100-1.1150 area could be where the sellers might step back in. This bearish outlook will become invalid upon a potential break above the resistance trend of the bear channel, around the 1.1200 area. Assuming that doesn’t happen, the next potential key support levels, or bearish objectives, to watch include 1.1040, 1.0825/55 and then the long-term 78.6% Fibonacci retracement at 1.0755/60.
Source: eSignal and City Index


