November 16, 2021 9:17 PM

USD/TRY busted through 10.00 on Monday, to close at 10.0617. On Tuesday, the pair moved aggressively higher reaching 10.4386, a daily range high of near 3.8%. The pair has been on a one-way street higher since September 7th when the USD/TRY was at 8.2718. Since then, the pair is up over 26%! What began initially as higher inflation worldwide, has turned into a one-man spectacle for President Erdogan. He has stated that he does not want the Central Bank of Turkey to raise rates, despite latest inflation readings of 19.89% YoY as of the October reading. The highest increases were in food prices. President Erdogan went as far as to fire those who were against cutting rates and replace them with those who will. Thus, at the last Central Bank of Turkey meeting, central bank officials cut rates by 200bps from 18% to 16%, well above the 50bps cut that was expected. Combine Turkey’s high inflation and rate cuts, with the US inflation (rising but much lower at 6.2%) and a US central bank in tapering/”soon to be hiking” mode, and USD/TRY is reaching new highs daily.
The Central Bank of Turkey meets again on Thursday. Expectations are for another 100bps rate cut, putting rates down to 15%. The next inflation reading isn’t until December 3rd. However, at their last meeting, the Committee noted that “till the end of the year, supply-side transitory factors leave limited room for the downward adjustment to the policy rate.” Therefore, is there a chance the committee could underwhelm the markets and cut less than 100bps? In addition, since the October 21st meeting, the Turkish Lira is down nearly 12% vs the US Dollar. It is possible that Tuesday’s aggressive move could just be a stop-run above 10.000, which will result in a “Buy the rumor, sell the fact” for USD/TRY after the meeting on Thursday.
Trade USD/TRY now: Login or Open a new account!
• Open an account in the UK
• Open an account in Australia
• Open an account in Singapore
On the date of the last Central Bank meeting, USD/TRY moved aggressively above an upward sloping trendline dating back to mid-2018, near 9.2050. The pair tried to pull back 2 days later, forming a shooting star candlestick, but buyers took advantage of the pullback to add to long positions. The pair continued higher, with new highs daily. The next target is the 261.8% Fibonacci extension from the high on October 25th to the low on October 26th, near 10.5484. Above there, resistance is at the psychological round number at 11.0000. Note that the RSI is above 87, in extreme overbought conditions. However, its difficult to rely on oscillators when price is moving parabolic.
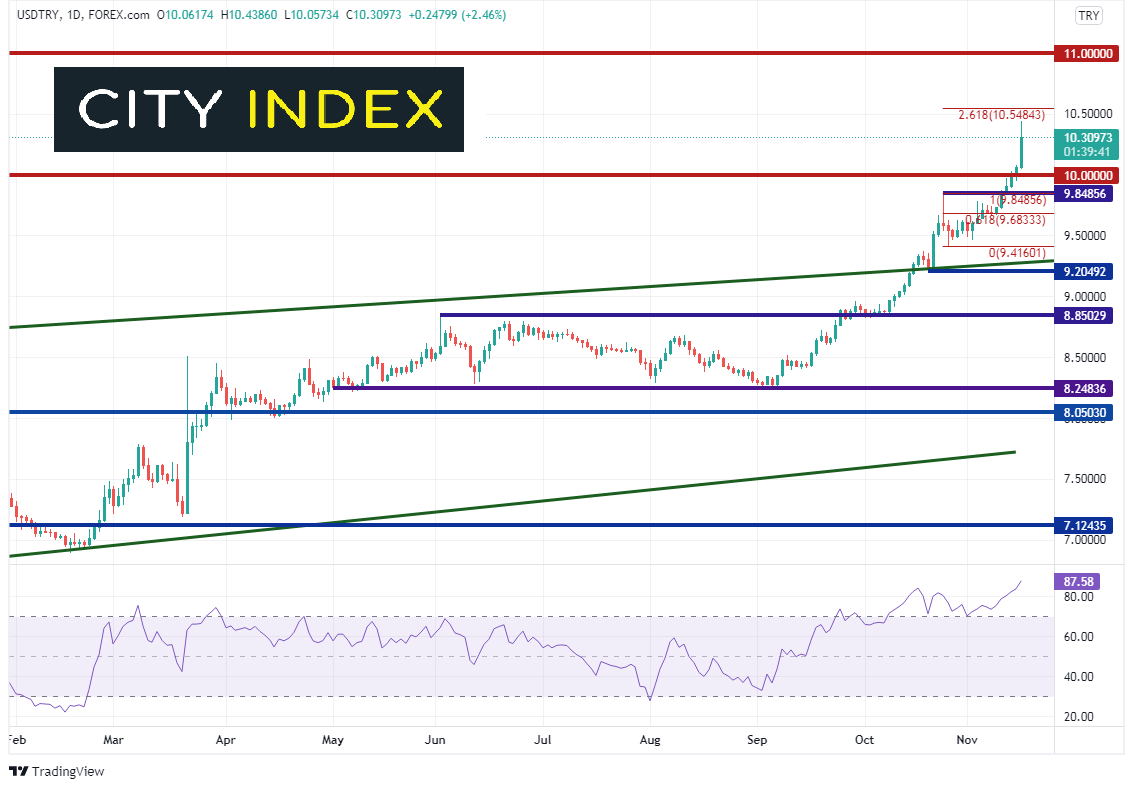
Source: Tradingview, Stone X
On a 240-minute timeframe, when USD/TRY broke above 10, it also moved above the top, upward sloping trendline from a rising wedge. First support is back at that trendline and the psychological round number between 10.0000 and 10.0333. Below there is the bottom trendline of the wedge near 9.90 and then horizontal support at the October 24th spike high of 9.8486. Notice that the RSI is in extreme overbought territory. However, just was with the daily, it is best not to use the RSI during parabolic moves.
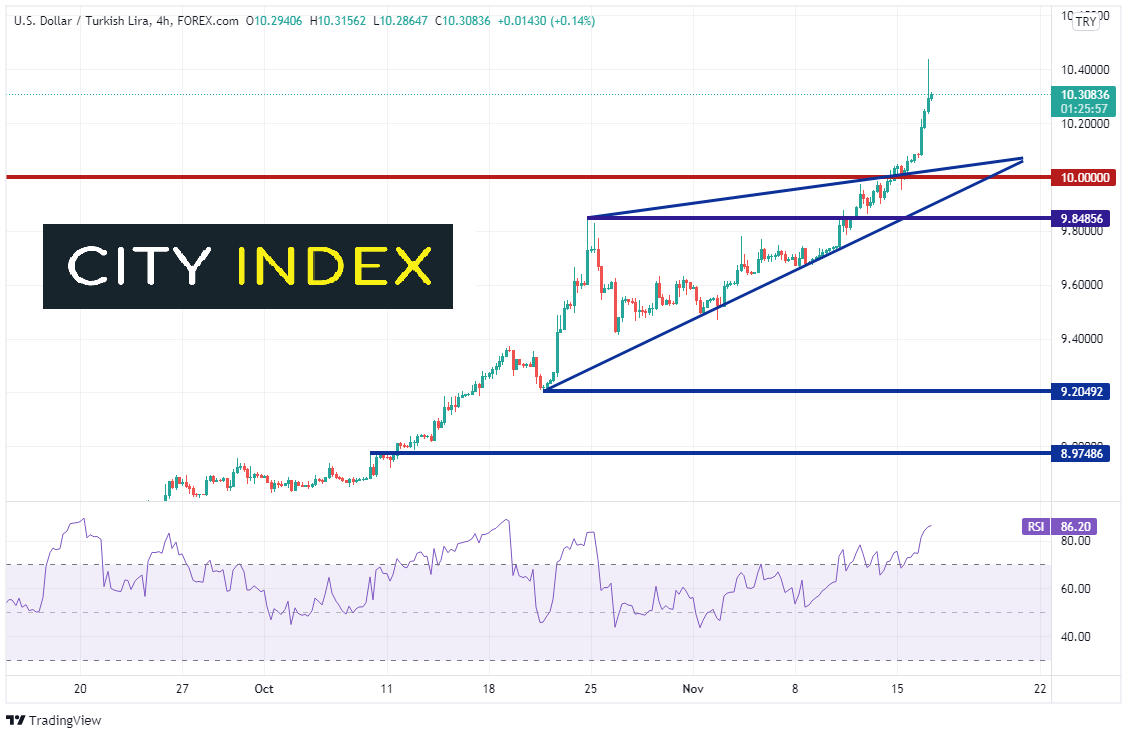
Source: Tradingview, Stone X
USD/TRY has been on a parabolic move higher over the last few weeks, busting to all-time new highs above 10 and taking out stops along the way. Could this move above 10 just be a “buy the rumor, sell the fact” heading into the central bank meeting? If the central banks raise 100bps (as expected) or less, watch for the possibility that USD/TRY may sell off aggressively.
Learn more about forex trading opportunities.
Latest market news
Yesterday 01:32 PM
Yesterday 09:35 AM
Yesterday 07:23 AM
Yesterday 04:48 AM
Yesterday 12:17 AM
July 25, 2024 10:39 PM
Latest Forex articles

Yesterday 12:17 AM

July 25, 2024 10:39 PM

July 25, 2024 03:59 PM

July 25, 2024 04:37 AM