USD RUB hits another all time high could we see 90 00 next
When most FX traders think of the implications of oil prices, they think of the impact on the Canadian dollar, or if they’re of a […]
When most FX traders think of the implications of oil prices, they think of the impact on the Canadian dollar, or if they’re of a […]
When most FX traders think of the implications of oil prices, they think of the impact on the Canadian dollar, or if they’re of a more Northern European persuasion, perhaps the Norwegian krone. Predictably, both of those currencies have been punished amidst the ongoing collapse in oil prices, but the Russian ruble has suffered the most grievous wounds.
Russia’s currency fell to a new record low (since the currency was redenominated in 1998) this morning, when one US dollar could purchase more than 85 rubles. Of course, policymakers sought to downplay the move, with President Vladimir Putin’s spokesman Dmitry Peskov stating, “I wouldn’t use the word ‘collapse.’ The rate is really changing, the rate is volatile, but it’s far from a collapse.” With all due respect to Mr. Peskov, when your currency loses nearly 20% of its value in less than three weeks, it’s definitely collapsing.
Though oil prices are bouncing back toward the $30.00 level (WTI) so far today, the longer-term outlook for the ruble remains dark. Earlier this week, the International Monetary Fund (IMF) published its forecast that the Russian economy would shrink an additional 1.0% this year, after contracting by fully 3.7% last year. The government’s own estimates are targeting a fiscal budget deficit of 3%, which doesn’t sound terrible until you consider that forecast is contingent on oil at $50.00/barrel, over 70% higher than yesterday’s close in WTI. Beyond the extensive economic concerns, Russia remains embroiled within testy geopolitical conflicts in the former Soviet bloc and the Middle East.
With no signs of an imminent long-term bottom in oil on the horizon, things may get a lot worse for the ruble before they get better.
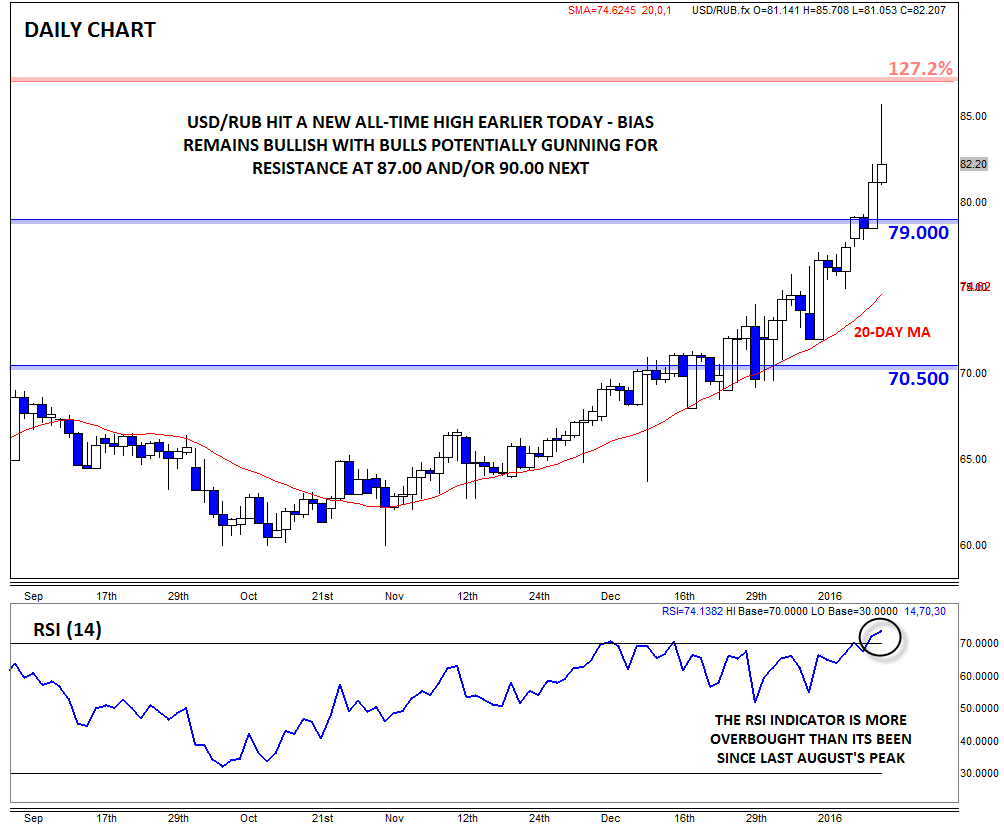
Technical view: USD/RUB
Turning our attention to the chart reveals exactly what you’d expect: USD/RUB has gone parabolic over the last few weeks. While the parabolic price action is often symptomatic of a “blowoff” style top, it’s worth noting that these types of moves can run further than most traders expect, so we’d argue for caution if readers trying to stand in front of this bullish freight train and pick a top. For what it’s worth, the RSI indicator is more overbought than it’s been at any point since last August’s peak, potentially hinting at a potential buying extreme.
If we do see a near-term pullback heading into February, support may emerge at three notable levels: the previous all-time intraday high at 79.00, the 20-day MA near 75.00, and the previous closing high (before the last month) in the 70.00-50 zone. Meanwhile, another leg lower in oil (to say nothing of another geopolitical flare up) could drive USD/RUB to 127.2% Fibonacci extension resistance at 87.00, followed by the next major psychological resistance level at 90.00.