

S&P 500 and VIX Key Points
- The VIX is falling below 12 to its lowest level since the start of the COVID pandemic ahead of the Fed.
- Prior drops below 12 in the VIX have led to historically below average returns in the S&P 500 over the next 1, 3, and 12 months.
- The short-term technical outlook for the S&P 500 remains bullish, especially if bulls are able to push the index above resistance at 4640.
VIX Analysis
Don’t look now, but the VIX, Wall Street’s proverbial “fear gauge” of implied volatility for the stock market, is falling below 12 to its lowest level since the start of the COVID pandemic. Helped along by a mostly “as expected” US CPI report this morning and the pervasive expectation that the Federal Reserve will leave monetary policy unchanged for at least the next three months, it’s not surprising that the VIX is in the doldrums.
For those that don’t follow the VIX closely, readings below 12 are relatively uncommon but not necessarily extremely low. Going back to the inception of the VIX in 1990, a reading of 12 sits in the 9.3% lowest of all VIX readings:
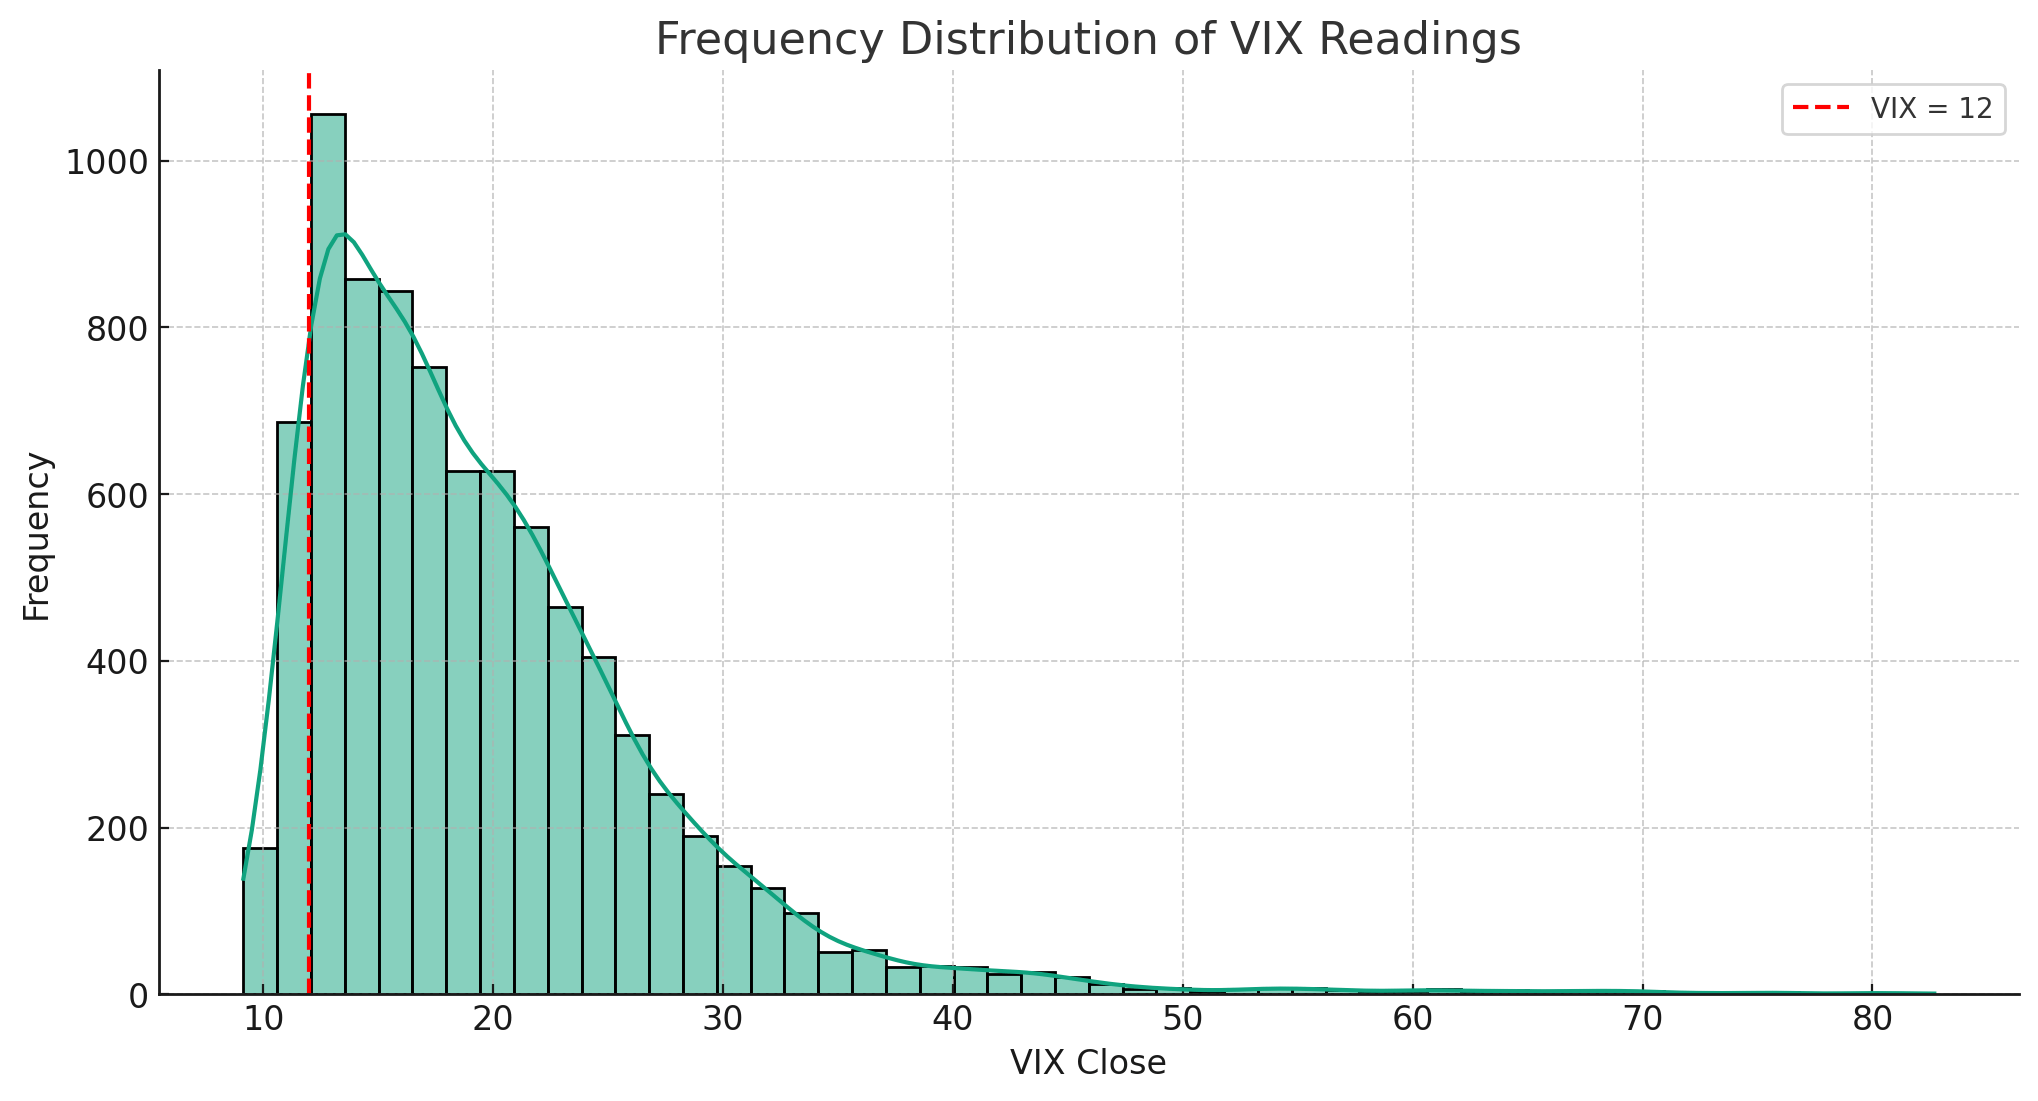
Source: TradingView, StoneX
More to the point, such a reading implies an average daily move in the S&P 500 of just 0.75% over the next 30 days, and an average weekly move of just 1.7%.
Looking at the historical data, low VIX readings have served as headwinds for the S&P 500. Looking out over the next 1 month, 3 months, and 1 year from the first time the VIX crosses below 12, S&P 500 returns have been consistently below the average for the whole post-1990 sample:
- Average 1-month return from when the VIX crosses < 12 = 0.75% (vs. 1.06% in all periods)
- Average 3-month return from when the VIX crosses < 12 = 2.20% (vs. 3.18% in all periods)
- Average 12-month return from when the VIX crosses < 12 = 11.90% (vs. 13.74% in all periods)
These statistics are perhaps not a surprising for experienced traders, given that low VIX readings signal a complacent, sanguine market and stock indices historically tend to climb a “wall of worry.” Of course, its worth noting that past performance is not necessarily an indication of future returns, and factors other than the level of the VIX will impact the performance of the S&P 500.
S&P 500 Technical Analysis – SPX Daily Chart
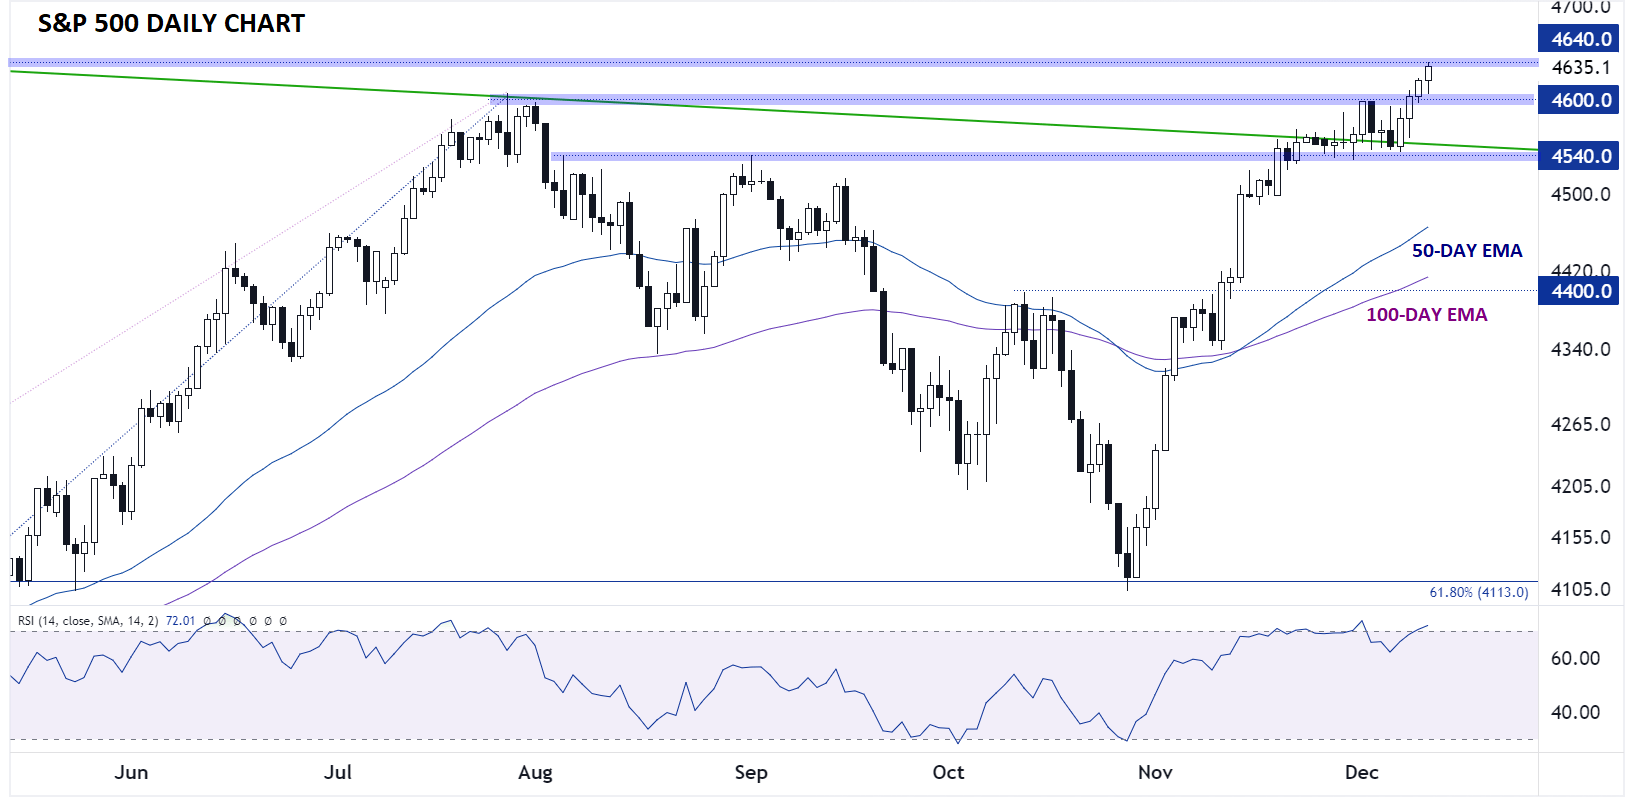
Source: TradingView, StoneX
Technically speaking, the short-term outlook for the S&P 500 is generally strong for the bulls. After spending the last two weeks consolidating just below the 2023 highs at 4600, the index broke above that barrier to start this week and is holding the gains in post-CPI, pre-Fed trade today.
While it is notable that the 14-day RSI is back in overbought territory after the latest 4-day rally, it’s not historically stretched, suggesting the S&P 500 could extend its rally toward its all-time record high around 4815 if it can convincingly break above the March 2022 highs at 4640. If we do see pullback (perhaps if the Fed is more hawkish than expected tomorrow), bulls may look to buy the dip into near-term support at 4600 and 4540; only a break below that level would call the near-0term bullish trend into question.
-- Written by Matt Weller, Global Head of Research
Follow Matt on Twitter: @MWellerFX
Latest market news
Yesterday 01:32 PM
Yesterday 09:35 AM
Yesterday 07:23 AM
Yesterday 04:48 AM
Yesterday 12:17 AM
July 25, 2024 10:39 PM
Latest US SP 500 articles


July 11, 2024 07:45 PM

June 18, 2024 01:57 PM

May 24, 2024 11:52 AM