
Medium-term technical outlook on Nasdaq 100 (US Tech 100)
click to enlarge charts
Key Levels (1 to 3 weeks)
Intermediate resistance: 8300
Pivot (key resistance): 8370
Supports: 8000 & 7800
Next resistance 8500/560
Directional Bias (1 to 3 weeks)
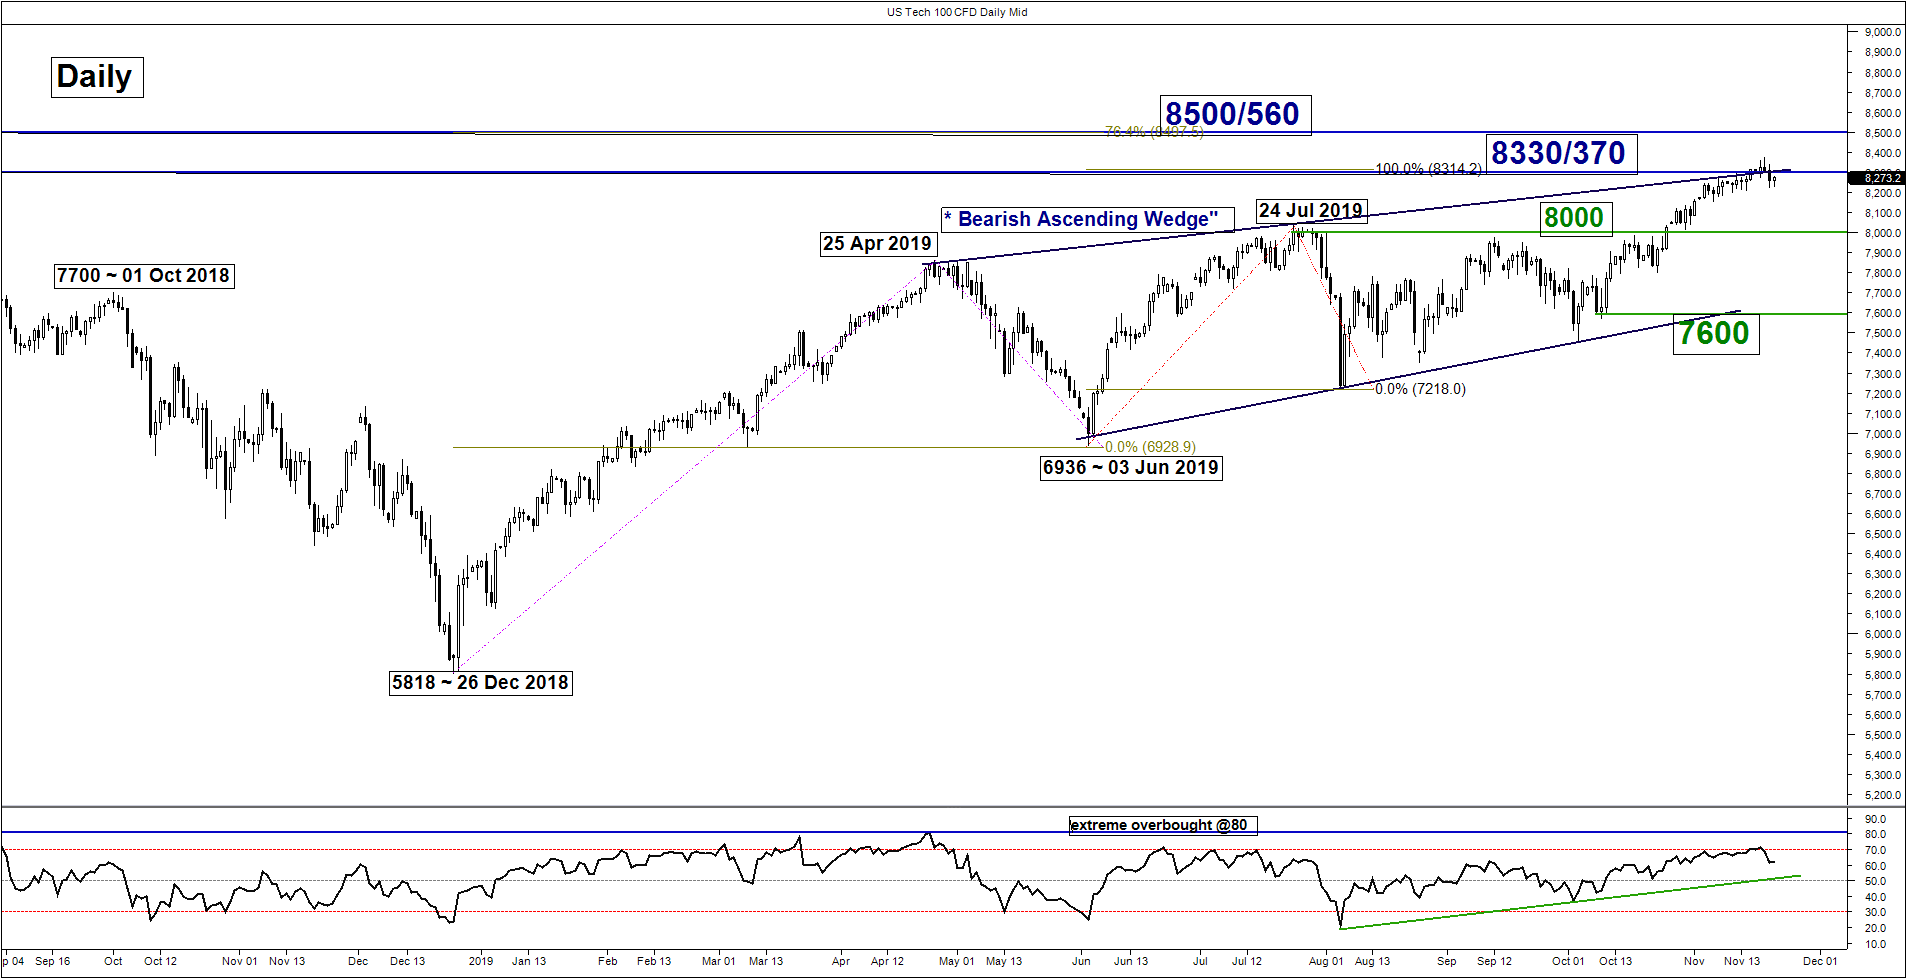
Bearish bias in US Tech 100 (proxy for Nasdaq 100 futures) below 8370 key medium-term pivotal resistance for a potential corrective decline to target the next support at 8000 and below exposes 7800 next.
On the other hand, a clearance with a daily close above 8370 invalidates the mean reversion decline scenario for a continuation of the impulsive upleg sequence to towards 8500/560 (Fibonacci expansion cluster) next in the first step.
Key elements
- The recent 7% rally from 23 Oct 2019 low of 7801 has tested the upper boundary of a medium-term bearish “Ascending Wedge” range configuration in place since 03 Jun 2019 low. Yesterday, 20 Nov, it has staged a 1% retreat from the “Ascending Wedge” resistance at 8330/370 which is also coincided with a Fibonacci expansion cluster (see daily chart)
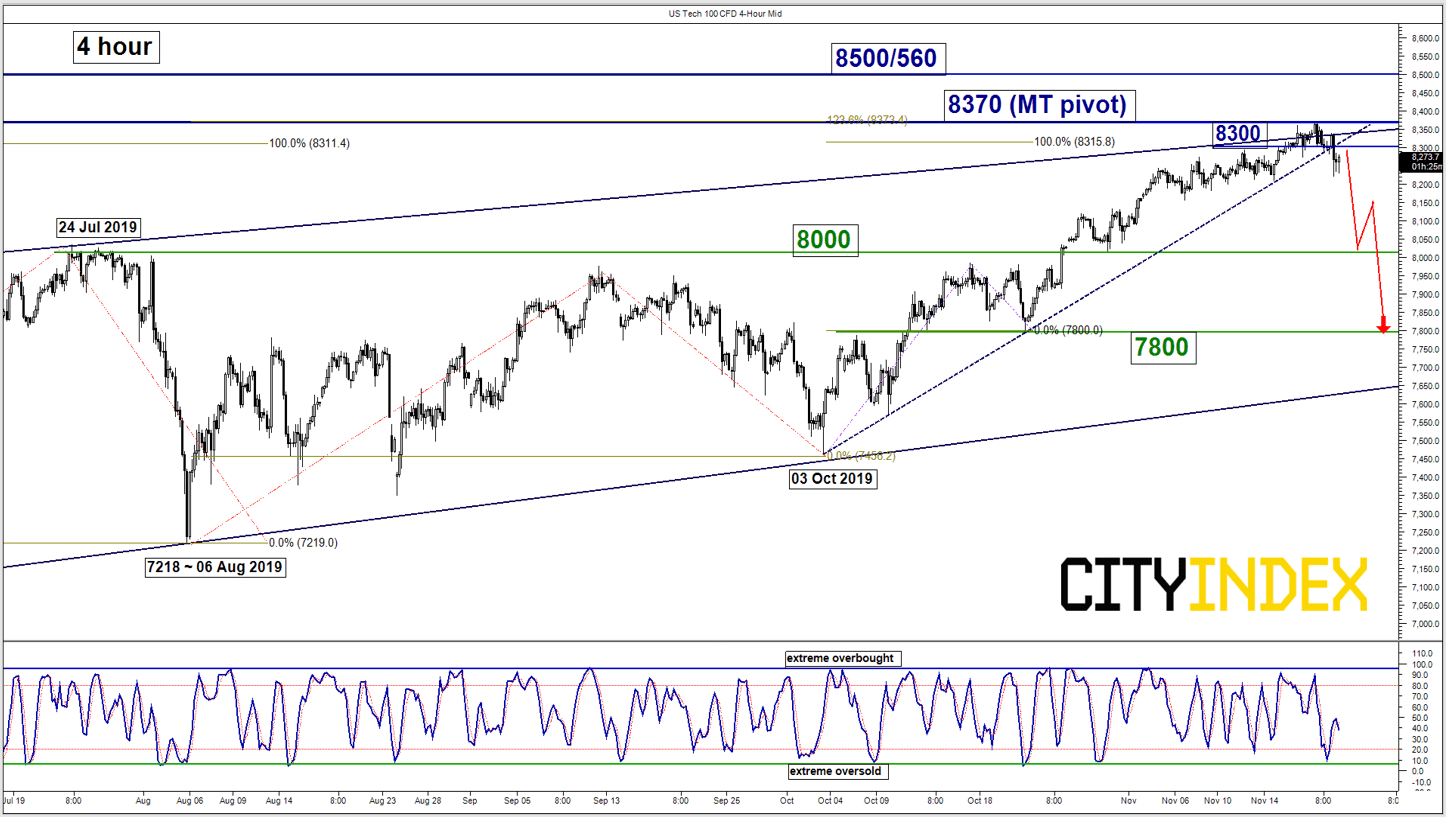
- In the shorter-term (4-hour chart), the price action of the Index has staged a bearish breakdown from its minor ascending support from 03 Oct 2019 low now turns pull-back resistance at 8300. This observation suggests the minor uptrending phase has been damaged.
- The 7800 support is defined by the 22 Oct 2019 swing low and the 61.8% Fibonacci retracement of the recent up move from 03 Oct low to 19 Nov 2019 high.
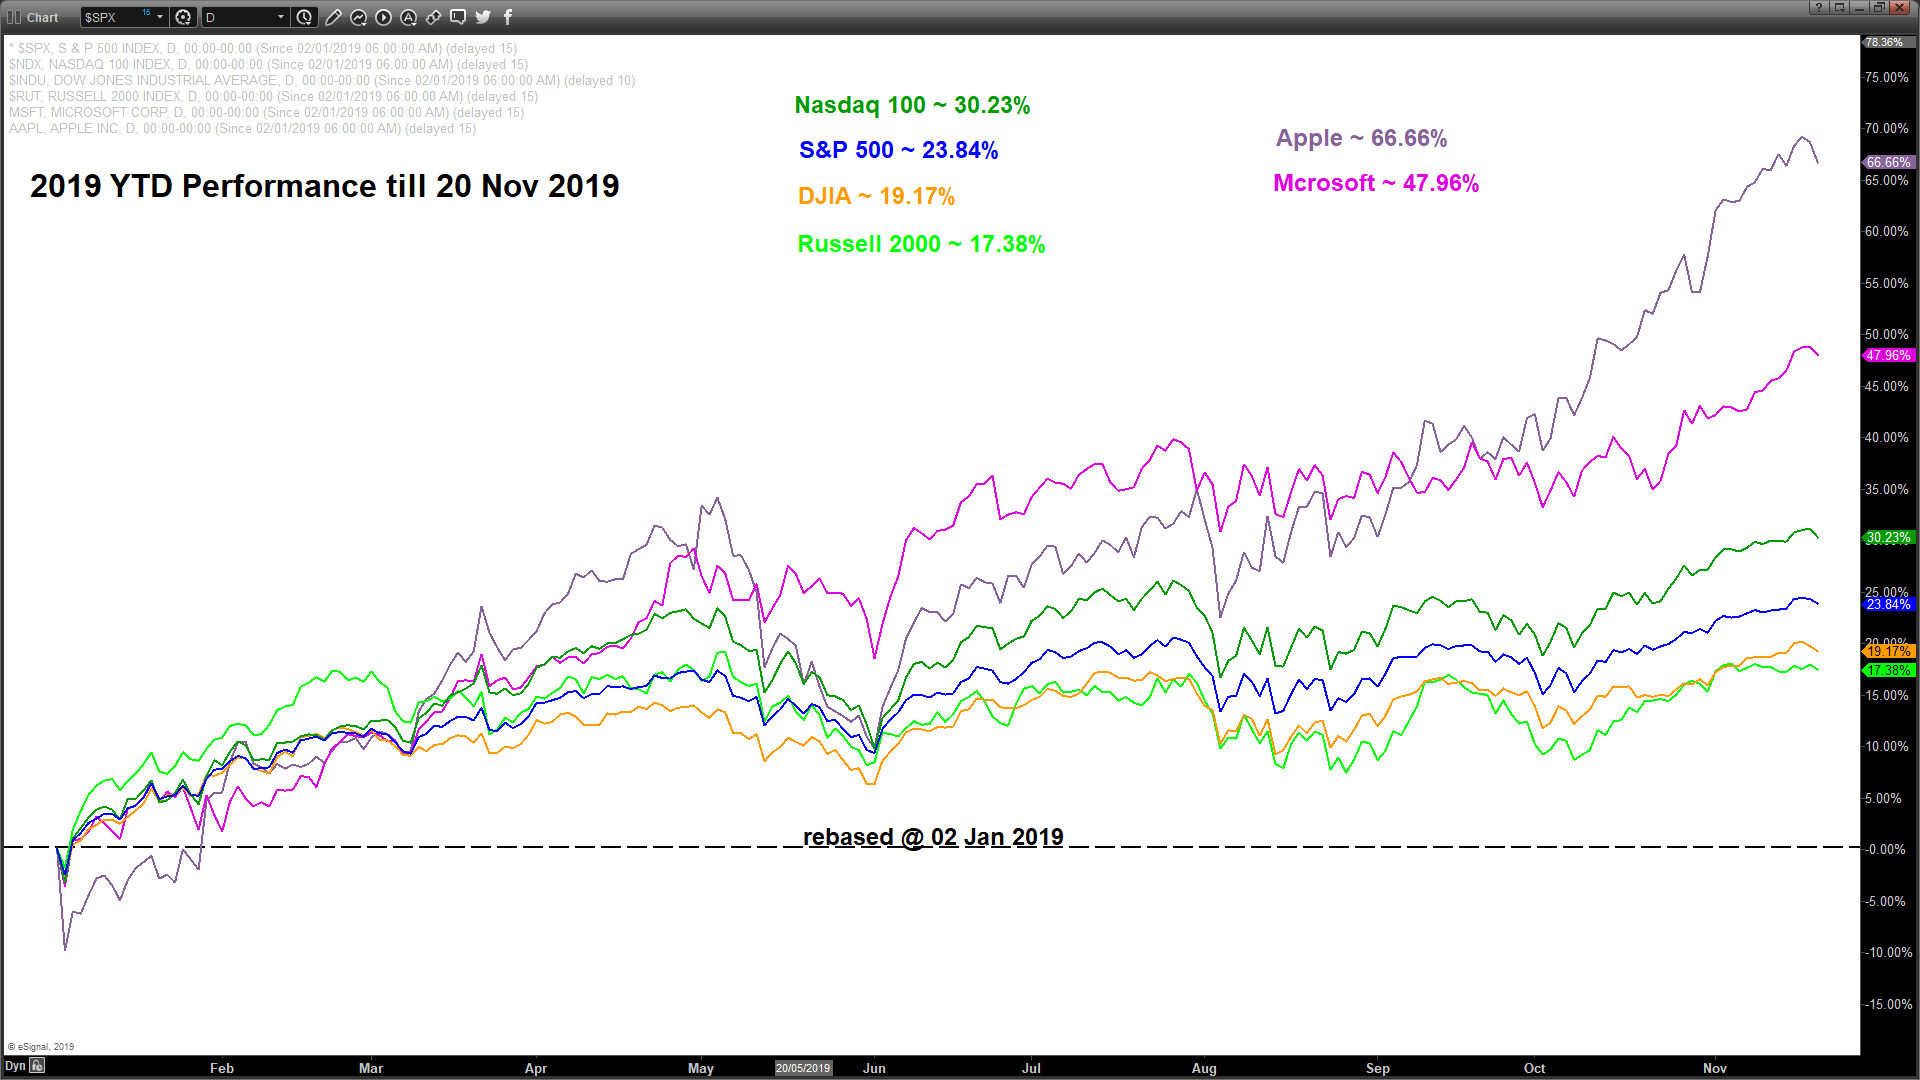
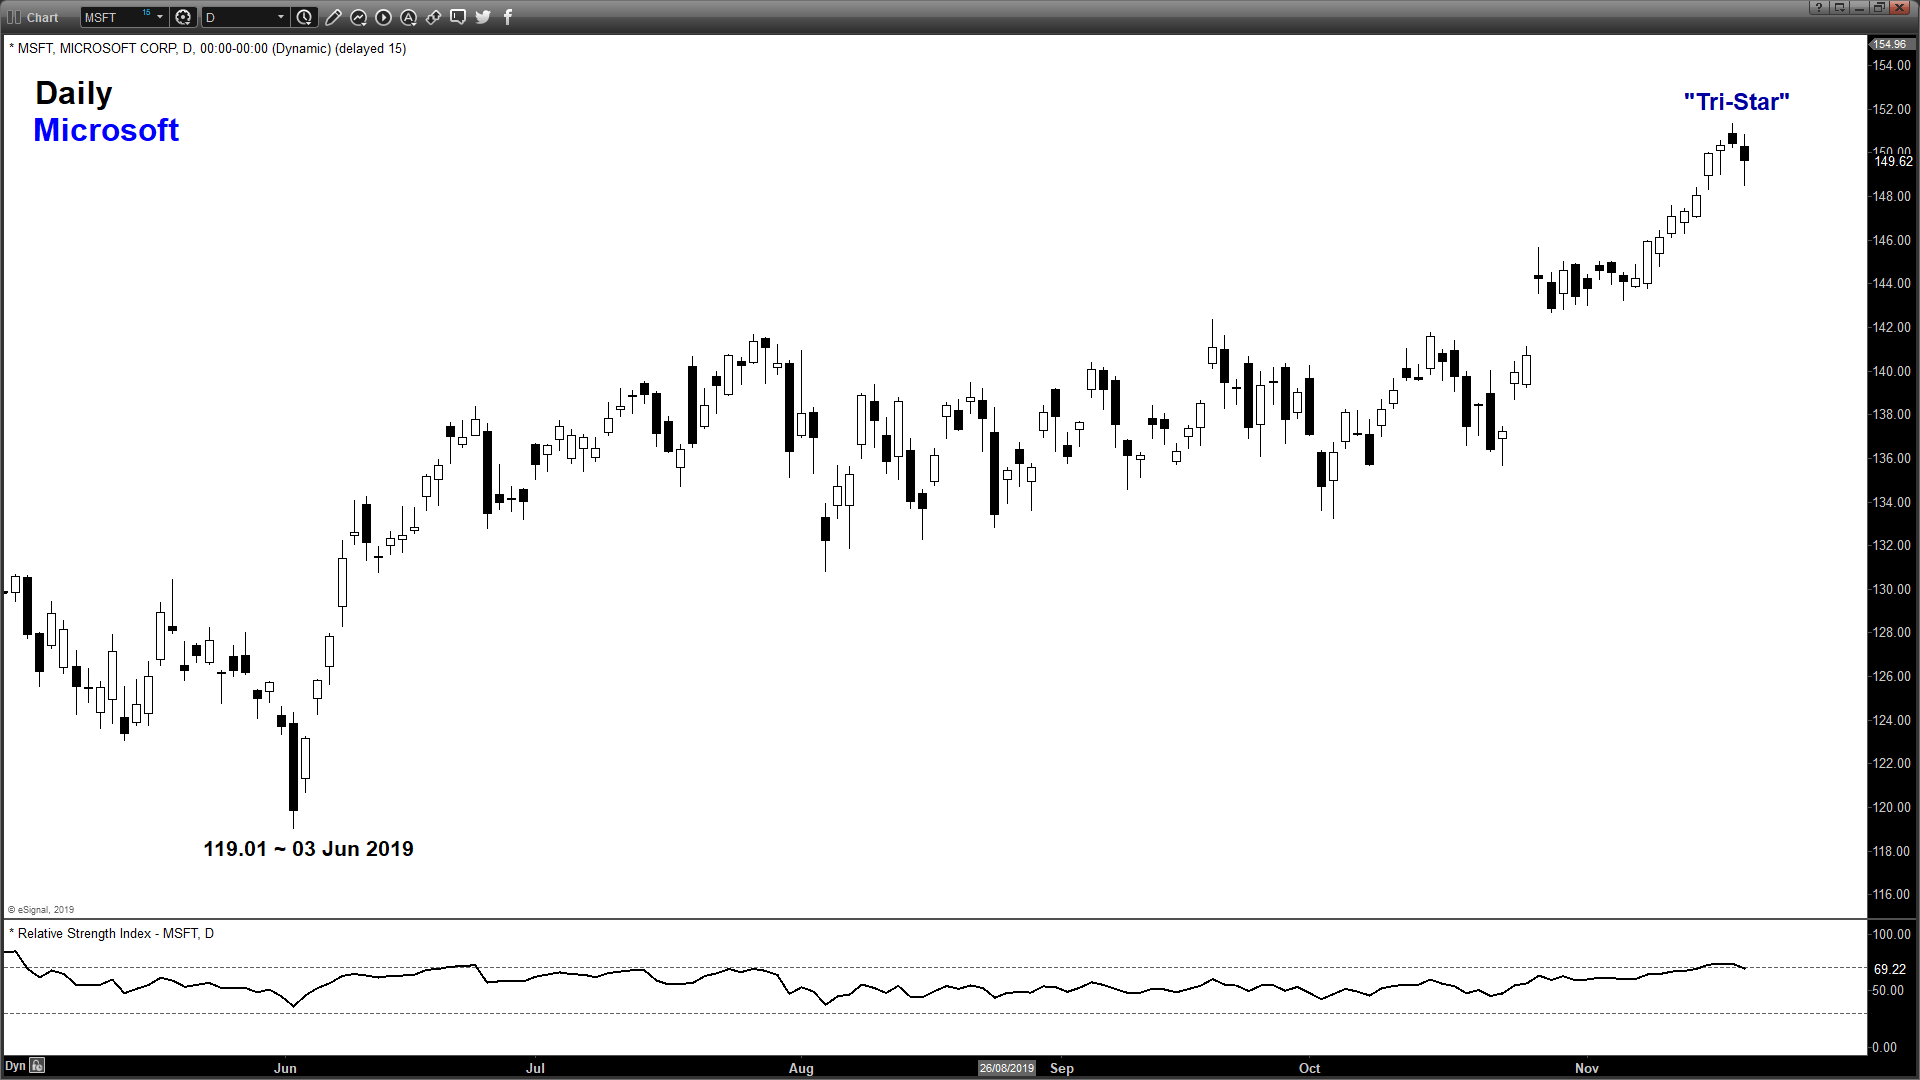
- Since the start of 2019, the Nasdaq 100 is the best performing major U.S. stock index (up by 30.23% excluding dividends) till 20 Nov 2019. Apple and Microsoft are the two component stocks that have the most significant contribution to the aggregate return of the Nasdaq 100 where Apple and Microsoft have recorded gains of 66.66% and 47.96% respectively.
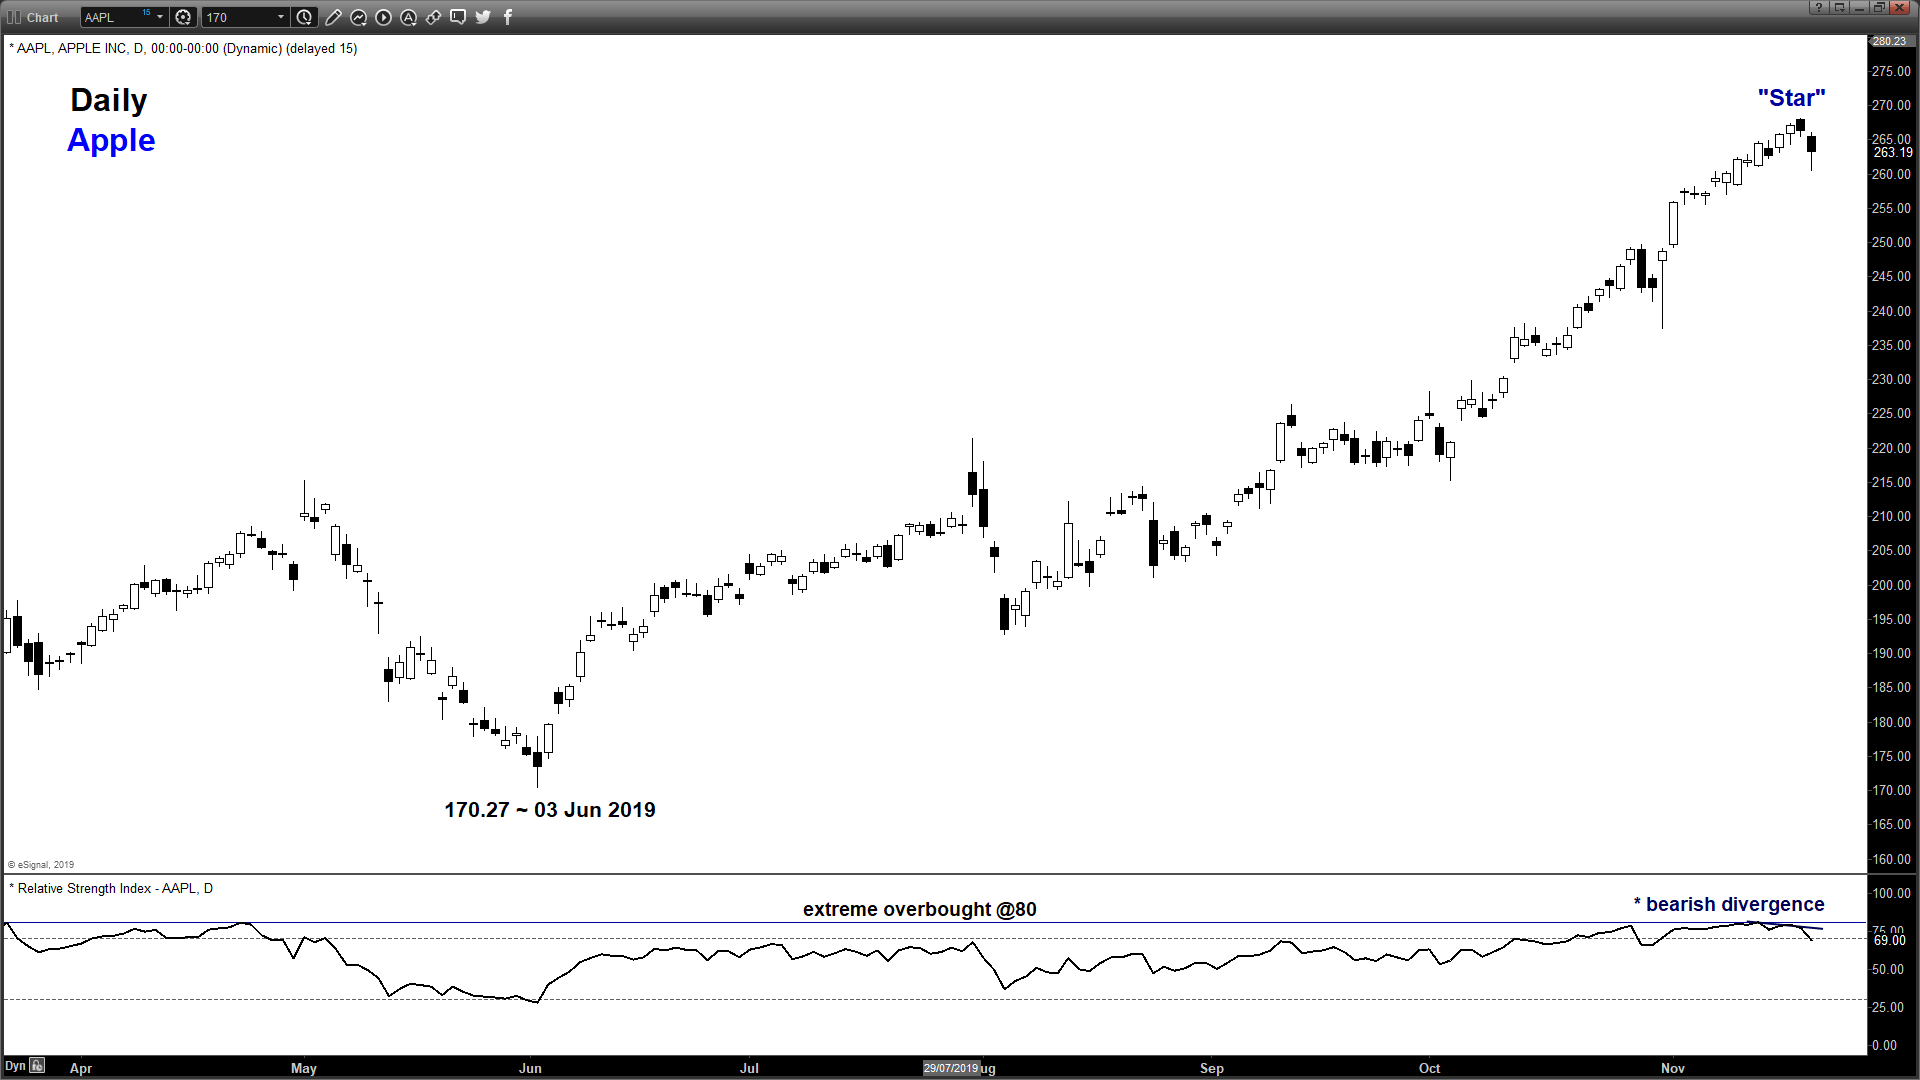
- The latest price action of Apple and Microsoft has started to show signs of bullish exhaustion after their significant run-up.
- Apple has formed a bearish daily candlestick at the close of yesterday, 20 Nov U.S. session after a prior “Star” candlestick formed on 19 Nov coupled with a bearish divergence signal seen on the daily RSI oscillator at an extreme overbought level.
- In conjunction, Microsoft has formed a “Tri-Star” bearish candlestick pattern, a configuration that takes into account of three session of price action (18 Nov, 19 Nov & 20 Nov). This type of candlestick pattern tends to indicate a potential mean reversion decline in price action after a significant rally,
Charts are from eSignal
Related Analysis:
Stock Indices Weekly Technical Outlook: New all-time high U.S stock market with euphoric mood
Latest market news
Today 08:15 AM
Latest Apple articles

November 3, 2023 01:22 PM

October 11, 2023 02:41 PM

September 13, 2023 10:03 AM
September 8, 2023 08:52 AM