

ADP employment was expected to add around 300k jobs in yesterday report. Yet the 128k delivered not only missed the mark stupendously but was also the lowest print since the pandemic. Typically we would expect equity markets to suffer, but these re not normal times. Equities have faced a lot of selling pressure as they fear the hawkishness of the Fed. Yet yesterday’s disappointment plays into the mantra that the Fed have reached ‘peak hawkishness’ and may be forced to scale back the level of aggressive rate hikes pencilled in by markets. And should today’s Nonfarm payroll report miss the mark, we could see equity markets extend those gains further still.
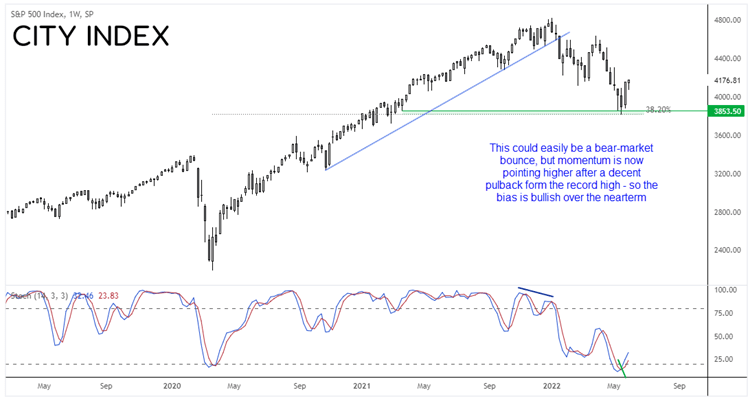
S&P 500 weekly chart:
The S&P 500 has seen an ABC correction from its record high. Whether we have seen the final low of the correction remains debatable (given the prospects of lower growth, high inflation and a hawkish Fed). This could simply be part of a bear-market bounce and therefore we’re in a countertrend rally of a much deeper correction. But we can see that it has had a decent retracement from those highs, support was found at a long-term 38.2% Fibonacci ratio, momentum has turned higher and the stochastic oscillator generated a buy signal last week.
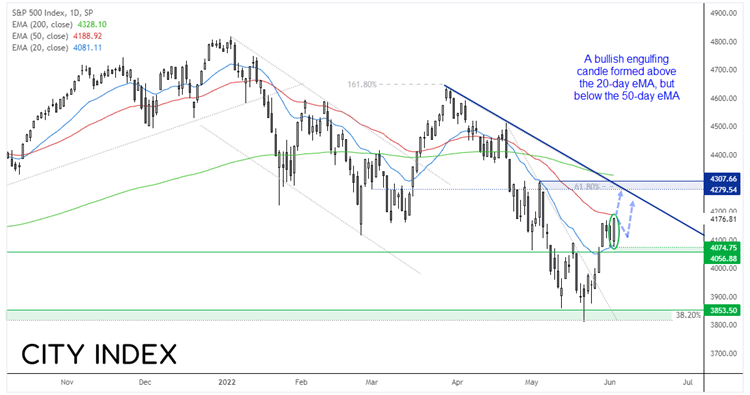
S&P 500 daily chart:
The daily chart also looks promising for the bull-camp. A bullish engulfing (and bullish outside) day formed at the 20-day eMA and closed to a 4-week high. Momentum from the 3800 low was strong and invalidated a bearish trendline. Should prices hold above 4070 then we anticipate a breakout – back above the 50-day eMA – and move to the 4279 resistance zone which includes a 61.8% Fibonacci projection and 4300 handle. Whereas a break below the 4070 area means we may have seen an important swing high.
How to trade with City Index
You can easily trade with City Index by using these four easy steps:
-
Open an account, or log in if you’re already a customer
• Open an account in the UK
• Open an account in Australia
• Open an account in Singapore
- Search for the company you want to trade in our award-winning platform
- Choose your position and size, and your stop and limit levels
- Place the trade
Latest market news
Yesterday 01:32 PM
Yesterday 09:35 AM
Yesterday 07:23 AM
Yesterday 04:48 AM
Yesterday 12:17 AM
July 25, 2024 10:39 PM
Latest Technical Analysis articles

July 25, 2024 03:59 PM

July 24, 2024 07:26 PM

July 24, 2024 09:55 AM

July 23, 2024 11:58 AM