

- S&P 500 analysis: Bullish exhaustion ahead of big earnings, data
- EUR/USD outlook: Technical analysis point lower
- Copper outlook: Metal hits resistance
Welcome to Technical Tuesday, a weekly report where we highlight some of the most interesting markets that will hopefully appease technical analysts and traders alike.
In this edition of Technical Tuesday, we will analyse the S&P 500, copper and EUR/USD.
S&P 500 analysis: Bullish exhaustion ahead of big earnings, data
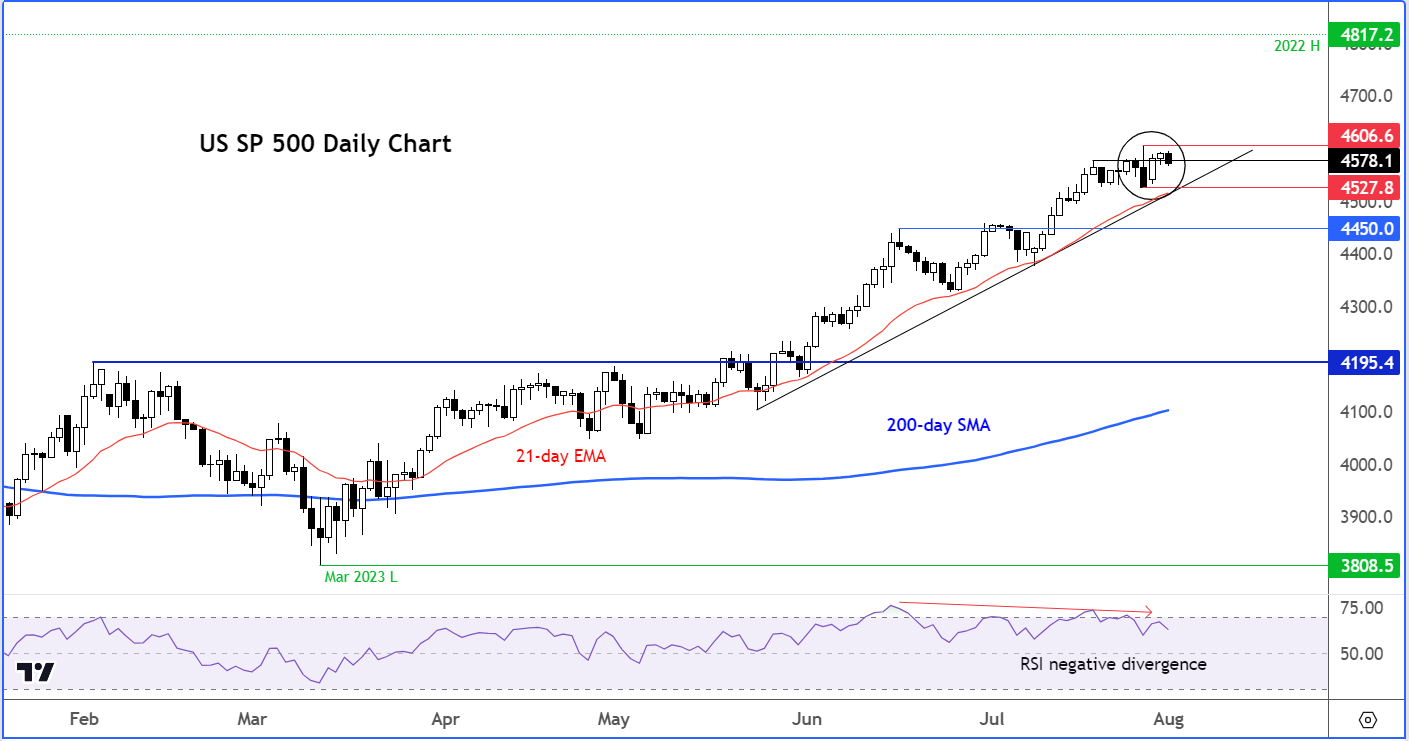
It looks like stocks on Wall Street are taking a breather from the relentless rally.
The S&P 500 reached a 16-month high last week, before losing some momentum on Thursday. And while the bulls quickly bought that dip, Thursday’s high has not been broken, which is giving the bears a clear invalidation level to work with.
There’s been some light bearish price action observed on the lower time frames, but on the daily, we haven’t had anything else part from that bearish engulfing candle from Thursday. That engulfing candle failed to bring back the sellers, with many traders afraid of standing on the way of the rally – and you wouldn’t blame them given that the S&P is now just 5% shy of breaching its record high from last year, despite all the interest rate hikes, high inflation and a manufacturing sector being stuck in the contraction for several months now.
Still, we could see some downside action, with investors likely to sit on their hands ahead of Friday’s US employment data and earnings from giants Apple and Amazon on Thursday. Speaking of earnings, a
flurry of companies reported disappointing earnings results today, which coupled with another poor ISM PMI survey and weaker jobs openings, seem to have dented market sentiment somewhat. Shares in JetBlue Airways, BMW and DHL Group all slumped following their earnings results and guidance.
The stock market bears would like to see a move below last week’s low at 4527 (i.e., Thursday’s bearish engulfing candle low) to trigger some downside momentum. A decisive break below Monday’s low at 5569 could be an early signal that we might be heading that way – so watch this level closely. Meanwhile, the Relative Strength Index (RSI) has been diverging with price action at ‘overbought’ levels, pointing to possible bullish exhaustion.
EUR/USD outlook: Technical analysis point lower
The EUR/USD fell along with the other major currency pairs, thanks largely to the strength of the dollar than weakness from the euro. Indeed, all the other major euro crosses such as the EUR/GBP, EUR/AUD and EUR/JPY were higher, thanks to mild strength in Eurozone data (e.g., German unemployment and core CPI from Eurozone
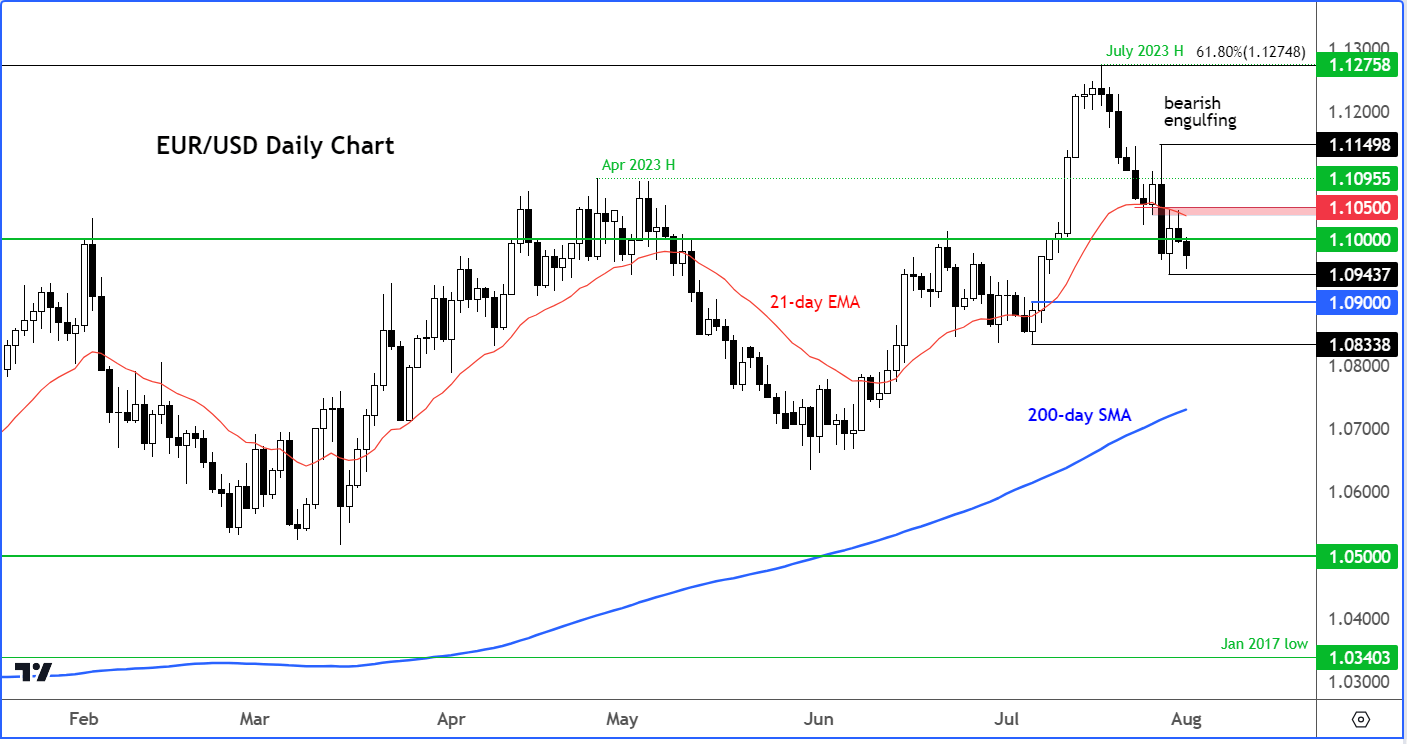
After that big sell-off on Thursday, the onus remains on the bulls to show up again with the dollar also rising against other major currencies. The EUR/USD bulls have failed to defend some key levels earlier last week and that run has continued with the loss of 1.10 handle today.
The key resistance area to watch now is around 1.1030 to 1.1050, which was previously support. Only if this area is reclaimed, or we see a clear bullish reversal at lower levels first, would the technical bis turn bullish again on this pair.
For now, though, the EUR/USD may well continue lower and drop to test liquidity below last week’s low at 1.0943 next.
The next level of key support is around 1.0900, which was the base of the prior rally.
Copper outlook: Metal hits resistance
Copper, gold and silver all fell on Tuesday, due largely to a strong US dollar.
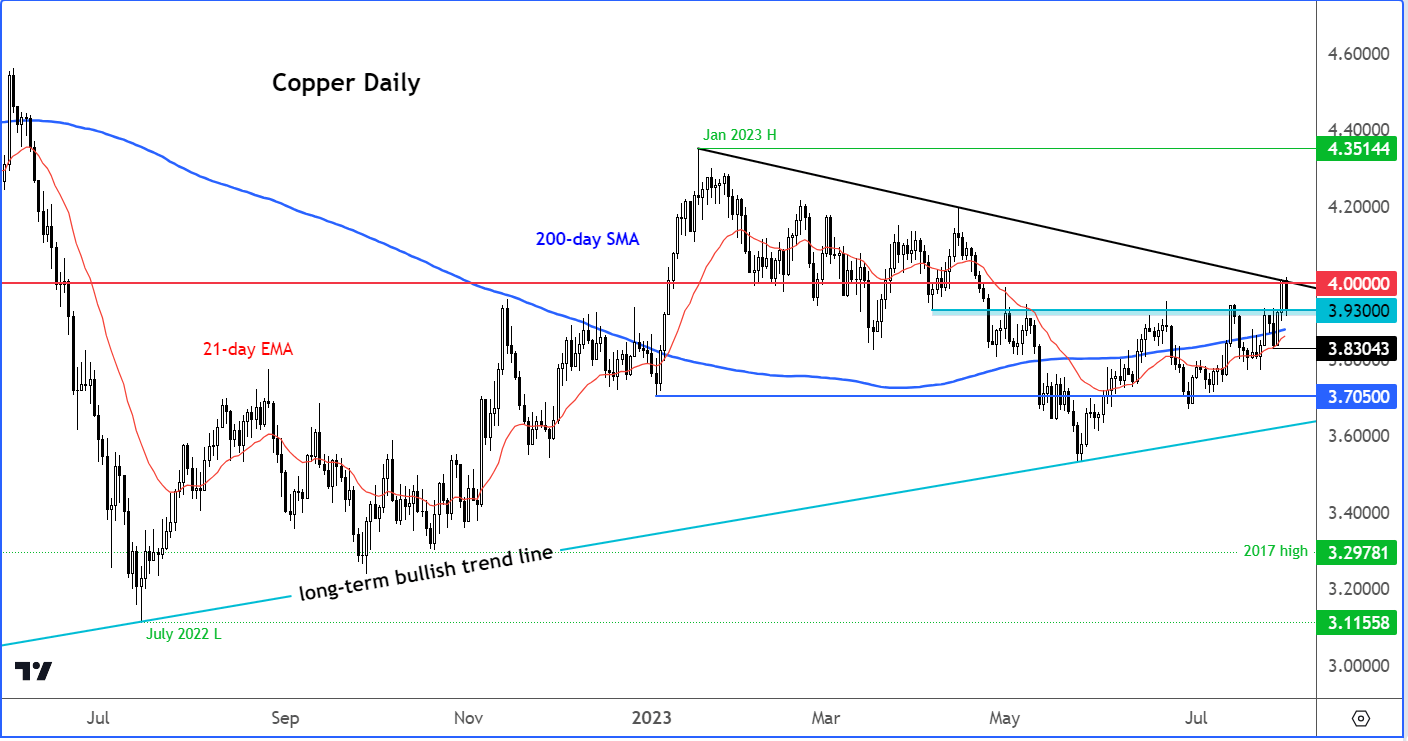
Prior to today’s sell-off, copper has been generally trending higher ever since it bounced off its long-term bullish trend line in May, when it bottomed out around 3.5300 area. Since then, it has put in a few higher lows, broken several resistance levels, and climbed back above its 200-day moving average. The technical bias has therefore been bullish.
Most recently, it had been finding resistance around 3.9300, an area which it eventually broke this Monday. However, the bullish momentum faded as price tried – and failed – to break key resistance around the psychologically-important level of 4.000, where we also have a bearish trend line converging.
At the time of writing, copper had retreated back to around that pivotal level of 3.9300. Once resistance, could copper find support here and start another move to the upside? Time will tell.
Conservative traders may wish to wait for the bearish trend line to break decisively before looking for bullish trades again or await a clear bullish signal at lower levels.
So, do watch out for a bull trap to potentially form here, given the strength of the USD and concerns over the global manufacturing sector etc. If copper were to close back below the 200-day average and Friday’s low around 3.8305, then that would be a major warning sign for the bulls.
Source for all charts used in this article: TradingView.com
-- Written by Fawad Razaqzada, Market Analyst
Follow Fawad on Twitter @Trader_F_R
How to trade with City Index
You can trade with City Index by following these four easy steps:
-
Open an account, or log in if you’re already a customer
• Open an account in the UK
• Open an account in Australia
• Open an account in Singapore
- Search for the company you want to trade in our award-winning platform
- Choose your position and size, and your stop and limit levels
- Place the trade
Latest market news
Yesterday 01:32 PM
Yesterday 09:35 AM
Yesterday 07:23 AM
Yesterday 04:48 AM
Yesterday 12:17 AM
July 25, 2024 10:39 PM
Latest Technical Tuesday articles

July 23, 2024 05:20 PM

July 16, 2024 03:17 PM

May 14, 2024 06:00 PM
April 23, 2024 04:00 PM