

Should you be wishing upon the shooting star candlestick pattern? Find out with our complete technical analysis guide: including what the shooting star is, and how to trade it.
- What is the shooting star pattern?
- What does a shooting star candlestick mean?
- Inverted hammer vs shooting star candlesticks
- How to trade shooting stars
- Shooting stars summed up
What is the shooting star pattern?
The shooting star pattern is a single candlestick that appears on price charts after upward trends. It is a bearish reversal pattern, so if you spot a shooting star on a market, you might be about to see an uptrend swiftly retrace.
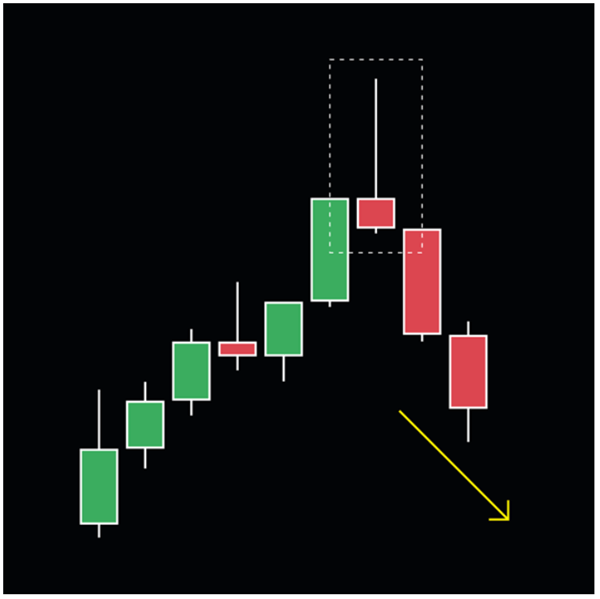
A shooting star candlestick has a short body and a long upper shadow, with little to no lower one. So within the session, the market’s price went up to new highs – but was swiftly beaten back, eventually ending up close to where it started.
Looking for more chart patterns? Take a look at our Japanese candlestick patterns cheat sheet.
What does a shooting star candlestick mean?
A shooting star candlestick means that buying momentum has been outpaced by sellers within the period. The pattern only appears during uptrends, and at the outset of the session bulls remain firmly in control – hence the long upper wick. But then bears take over and the reversal begins.
The short real body may make it appear that bulls and bears were evenly matched within the session. But after a long uptrend, that is still a sign that bullish momentum is on the wane.
If the reversal continues, we’d expect to see some red candles we can trade with a short position.
Learn more about how to read charts.
Red or green shooting star candlestick?
The colour of your shooting star candlestick isn’t crucial to the pattern. A red stick indicates that sellers took the market’s price below the opening price, a green one that they only managed to get it near to the open. While a red stick can give a stronger signal, both mean the same thing.
More important is the colour of the sticks that follow.
Inverted hammer vs shooting star candlesticks
Unlike most other chart patterns, the shooting star has a doppelganger: the inverted hammer. An inverted hammer looks exactly the same as a shooting star, with the only difference between the two patterns being where they appear. While shooting stars arrive at the end of uptrends, inverted hammers appear on downtrends.
It may seem counterintuitive, but the inverted hammer is also a reversal pattern – only this time, it’s a bullish one. Why? Because buyers took over at the beginning of the session, and while sellers retraced the gains they weren’t able to continue the downtrend. This is a key sign that bearish momentum may be losing out.
How to trade the shooting star candlestick
To trade a shooting star candlestick pattern, you’ll want to short the market and profit from the resulting downtrend. However, it isn’t usually a good idea to sell the moment you see one – you’ll want to confirm the opportunity and set up your risk management first.
Confirming the bear trend
Shooting stars are a single candlestick pattern that typically tell you sentiment is split between buyers and sellers. This means that false signals can appear relatively often, and confirming the bear trend is essential before you trade.
The most common way to confirm the new move is to wait a couple of sessions. If the market starts to fall, it’s a good indication that bears have taken control. For a true confirmation, you’ll want the candlestick after the shooting star to have a high that’s below the star’s high, and to close lower.
However, you can also use other indicators such as RSI and the stochastic oscillator to double check that momentum has shifted.
Alternatively, a shooting star appearing at a known level of resistance will also add to the strength of the signal. If you’re using Fibonacci retracements, for example, then a shooting star appearing at a key retracement level can be a good sign to trade.
Setting your stop loss
As a single stick pattern, shooting stars don’t necessarily give any direct indication of where to place your stop loss and take profit.
However, the top of the upper wick can often provide a new level of resistance if the market doesn’t immediately fall in the next couple of sessions. If this is broken, then the uptrend may well continue – so placing a stop just above the top of the upper wick can be an effective strategy.
Many traders will use the next known area of support as a near-side profit target, using momentum indicators to track the trend once it is underway.
Start trading shooting star patterns
To start trading shooting star patterns with City Index, follow these steps:
- Open your City Index account and add some funds
- Log in to our award-winning Web Trader platform or download our mobile trading app
- Search for shooting stars on industry-leading TradingView charts
- Choose to buy to go long, or sell to go short
Alternatively, you can buy and sell our full selection of stocks, indices, forex, commodities and more with a City Index demo account, which gives you virtual funds to try out trading on live markets with zero risk. This is a great option for beginner technical traders, as it helps you plan your strategy without putting up any capital.
Shooting star example
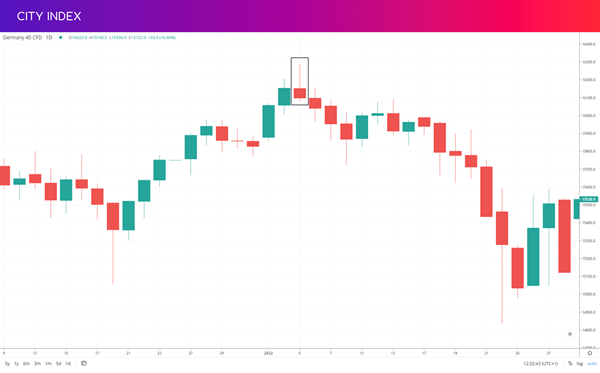
Here we can see a shooting star forming on a DAX 40 CFD (Germany 40) daily chart. After a sustained uptrend, the market opens at 16,150 then hits a high of 16,280 within the candlestick – but then bears take over, sending it back down to 16,100 at close.
The next few candlesticks confirm the downtrend, then after a period of consolidation the DAX breaks through support to a deep bear run.
For a closer look at what happened within the pattern, we can turn to an hourly chart:
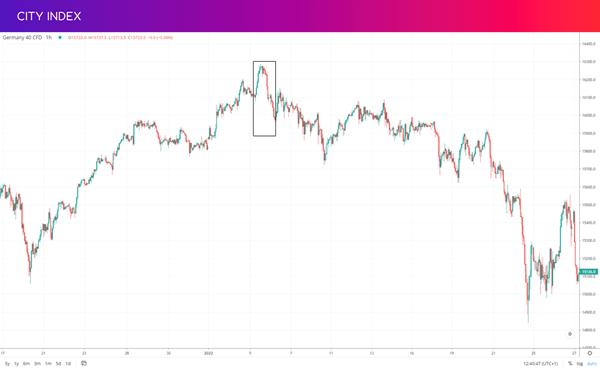
On the hourly chart, we can clearly see the switch in momentum that took place within the shooting star, as sellers take over and send the market down into a bear trend.
Shooting stars summed up
- Shooting stars consist of a single candlestick with a short body and a long upper wick
- They appear after uptrends and signal a potential impending bearish reversal
- If you spot a shooting star on a downtrend, it’s an inverted hammer
- Traders try to profit from the resulting bear trend after a shooting star
- Risk management is key, as the signal can fail
- To trade shooting star patterns, you’ll need a City Index account
- Or you can trade risk-free with a trading demo
Latest market news
Yesterday 01:32 PM
Yesterday 09:35 AM
Yesterday 07:23 AM
Yesterday 04:48 AM
Yesterday 12:17 AM
July 25, 2024 10:39 PM
Latest Technical Analysis articles

July 25, 2024 03:59 PM

July 24, 2024 07:26 PM

July 24, 2024 09:55 AM

July 23, 2024 11:58 AM