June 3, 2021 10:42 AM
Russia moving out of US Dollars: USD/RUB
Russian Finance Minister Anton Siluanov said earlier that its Sovereign Wealth Fund (SVF) will be exiting US Dollars. The reallocation will be nearly 40% into Euros, 30% into Yuan 10% into Gold, and the other 10% spread around. As this is Russia, it brings up a few questions: Did they already do the reallocation? According to Wikipedia, the SWF was worth $176.64 billion in August 2020. But that is just the valuation. How much of that is actually held in US Dollars? Are the Russians telling the truth? Why now? Is Russia trying to send a message ahead of the upcoming meeting between Biden and Putin? Biden plans to bring up the recent ransomware attacks on US company Colonial Pipeline and the US entity of Brazil’s JBS. Both attacks are said to be from groups inside Russia. The two meet on June 16th.
Whatever the reason, the 15-minute chart of USD/RUB shows that traders are taking the comments in stride. On the announcement, USD/RUB fell from 73.22 to 73.02, but quickly recovered as the DXY picked up a strong bid. However, the S&P 500 dropped 4198.25 down to 4175.75. It has since recovered some of the losses on the release of the ADP Employment data.
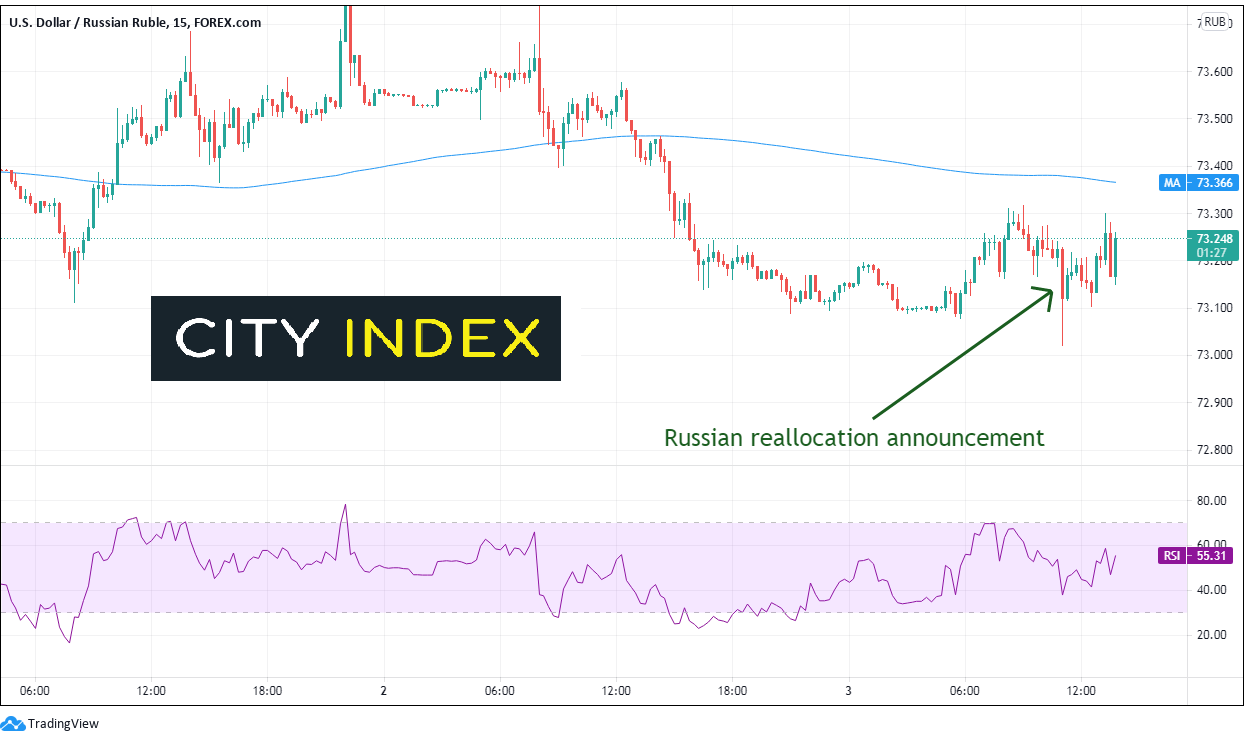
Source: Tradingview, City Index
The USD/RUB had been in a symmetrical triangle since March 2020. After a brief break below the bottom, upward sloping trendline in mid-March near 72.54, price formed a morning star candlestick formation pattern and traded back inside the triangle to the 61.8% Fibonacci retracement from the November 2020 highs to the March 16th lows, jut above 77.74. USD/RUB formed a head and shoulders pattern near those levels and broke below the neckline at 75.26 in late April. After a failed retest back above the neckline, price broken aggressively lower and took out the 200 Day Moving Average and the bottom trendline of the upward sloping trendline of the symmetrical triangle near 74.72. It is nearing the March 16th support lows at 72.54. The target for the head and shoulders pattern is the distance from the head to the neckline added to the breakdown point, which is near 71.40. Below there, price can fall to July 2020 lows near 70.55. First horizontal resistance is at 74.71, ahead of the 200 Day Moving Average at 74.72, and then the bottom trendline of the triangle near 75.20.
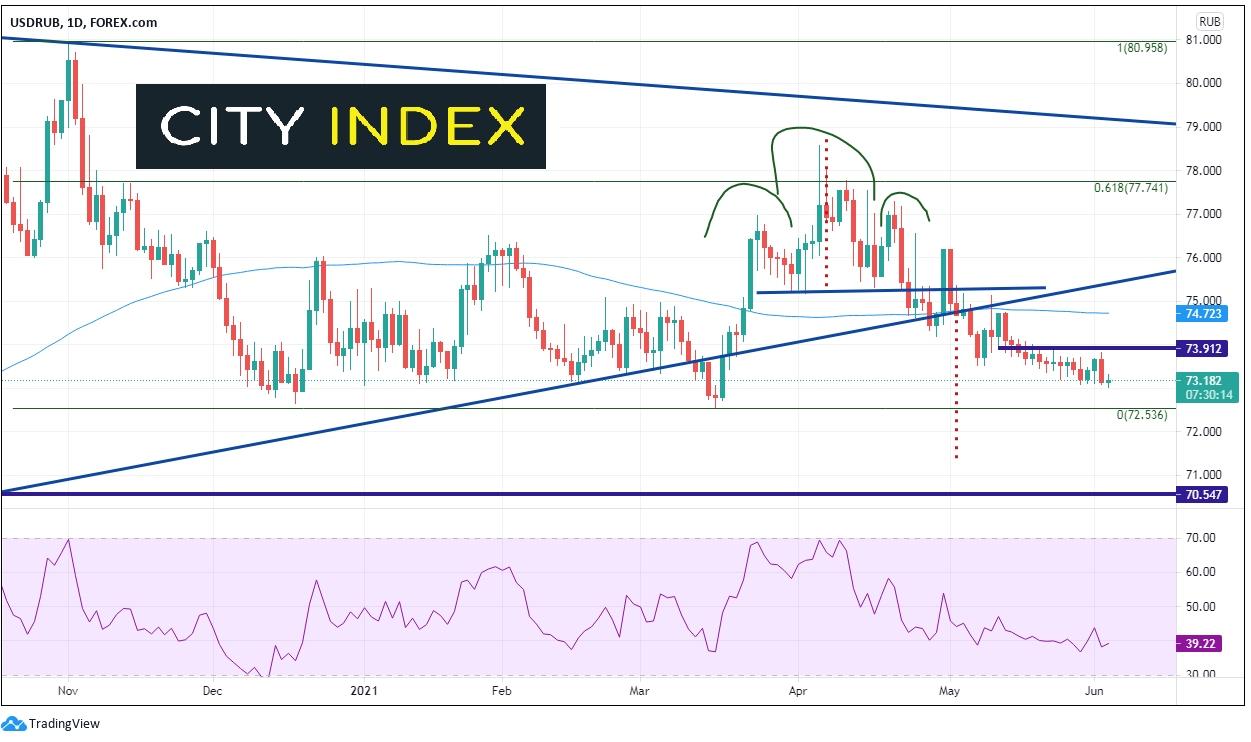
Source: Tradingview, City Index
Although Russian announced today that they are moving funds out of US Dollars in their SWF, the comments need to be taken with a grain of salt. Traders should consider if these comments are material or if they are just posturing ahead of the Biden-Putin meeting on June 16th.
Learn more about forex trading opportunities.
Latest market news
Yesterday 01:32 PM
Yesterday 09:35 AM
Yesterday 07:23 AM
Yesterday 04:48 AM
Yesterday 12:17 AM
July 25, 2024 10:39 PM
Latest Forex articles

Yesterday 12:17 AM

July 25, 2024 10:39 PM

July 25, 2024 03:59 PM

July 25, 2024 04:37 AM