

Oil & Canadian Dollar Takeaways
- Crude oil prices are rising for the 7th straight day on a persistent supply-demand imbalance.
- USD/CAD is falling to a 1-month low on the back of strong oil prices and rising CA PPI.
- Technical analysis shows WTI may be getting stretched while USD/CAD could have further to fall.
Oil & Canadian Dollar Fundamental Analysis
Flashing back to our Economics 101 classes, we know that, all else equal, a shortage of supply relative to demand will lead to rising prices. We’re see a textbook example of that phenomenon right now in the oil market, which the IEA recently estimated was structurally undersupplied by 1.2M bpd. That imbalance may moderate as we move into October and China reins back on building inventories, but regardless, demand remains robust despite signs of a slowing economy, and supply is tight in the current environment.
The above fundamental backdrop is of great interest to crude oil traders of course, but if you’re trading FX, your mind should go straight to USD/CAD any time there’s a discussion about oil prices. After all, oil is Canada’s most important export, and oil prices have historically had a relatively high correlation with the loonie. In addition to ongoing strength in oil, the Canadian dollar also received a jolt of strength from this morning’s PPI report, which showed that producer prices rose by 1.3% m/m in August, well above the 0.5% m/m gain expected by economists. With increasing signs that inflation may be picking up again across North America, it’s not a surprise that the Canadian dollar is among the strongest major currencies today.
Crude Oil Technical Analysis – WTI Daily Chart
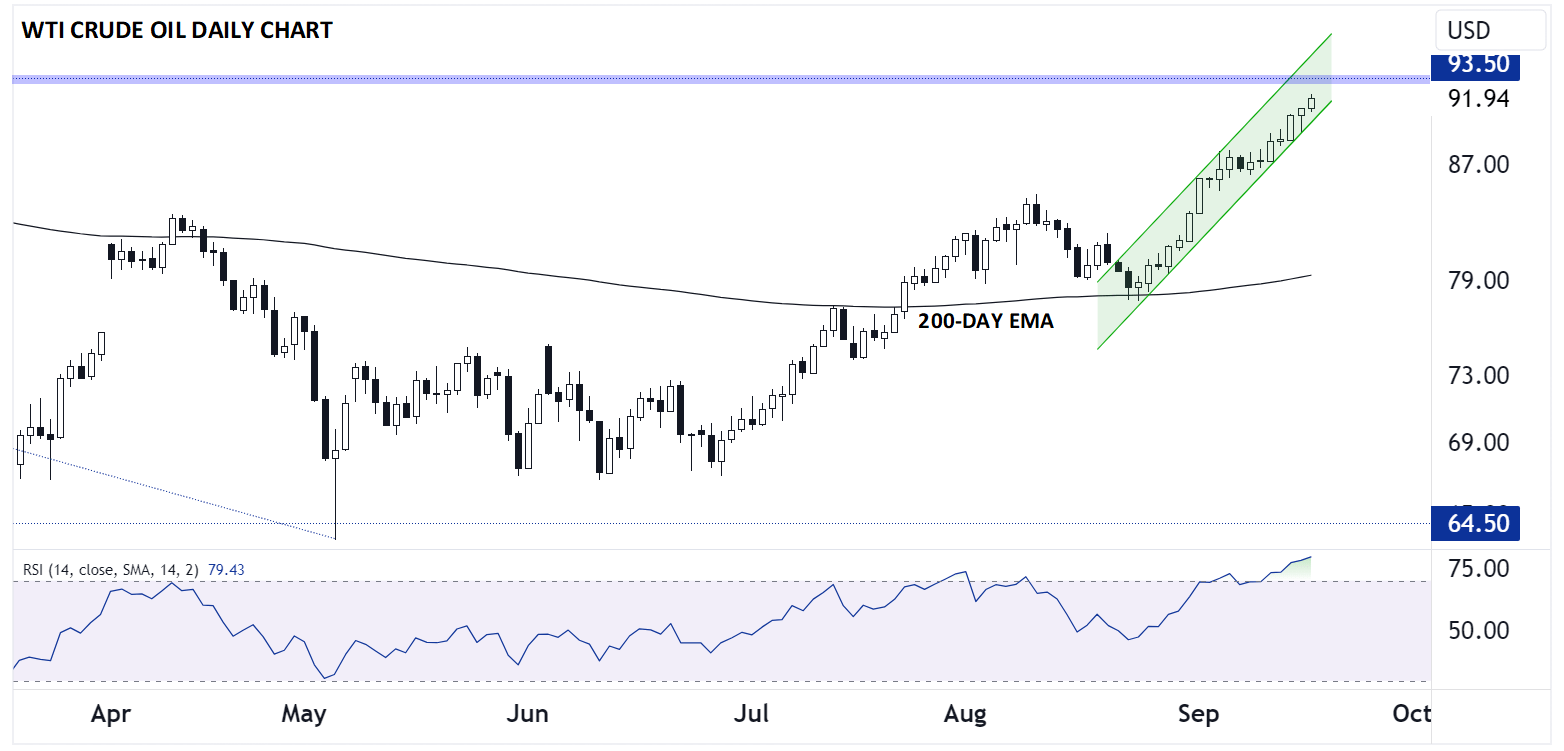
Source: TradingView, StoneX
WTI Crude Oil is rising for its 7th consecutive day to approach $92.00. The commodity has set new highs for the year in each of the last five days on the back of the supply-demand imbalance, but from a purely technical perspective, the rally may be getting stretched. As the chart above shows, the 14-day RSI is well within “overbought” territory, and WTI is approaching previous resistance from its Q4 ’22 double top pattern at 93.50. While there still may be a little bit of juice to squeeze from this rally, crude bulls may be looking to take some profits sooner rather than later.
Canadian Dollar Technical Analysis – USD/CAD Daily Chart
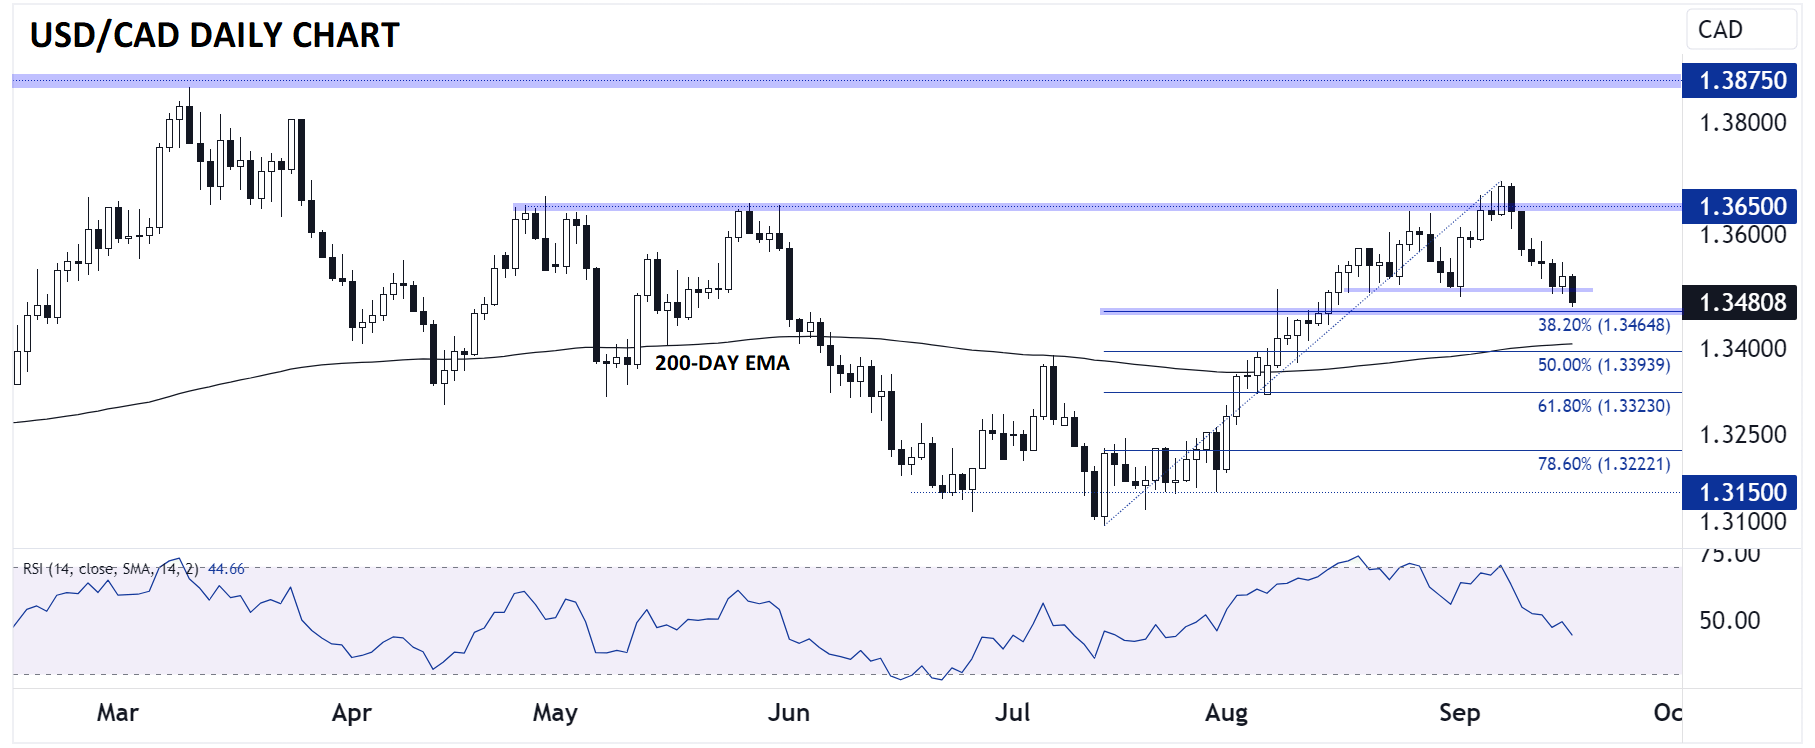
Source: TradingView, StoneX
The combination of continued strength in oil prices and the stronger-than-expected PPI figures out of Canada have driven USD/CAD notably lower today. As the chart above shows, USD/CAD has broken below the 1.35 level to a fresh 1-month low. If rates finish the day below this key short-term level, it would open the door for more downside toward the 38.2% Fibonacci retracement at 1.3465, followed by the 200-day EMA near 1.3400 next, though of course USD/CAD traders should also tune in closely for Wednesday’s FOMC meeting to see if it may change the underlying trend in the greenback.
Latest market news
Yesterday 01:39 PM
Yesterday 01:29 PM
Latest USD/CAD articles

April 16, 2024 04:24 AM

November 21, 2023 12:00 PM

November 10, 2023 04:00 PM

October 27, 2023 01:33 PM