January 6, 2022 9:18 PM

According to our in-house data, Nvidia (NVDA) is one of our most widely trade stocks. So, when the price began to pull back from all-time highs at 346.47 in late November 2021, many traders may have been wondering why. First, as with so many other stocks, price moved lower on November 26th, 2021 as the Omicron variant of the coronavirus came to light. Price continued to fall to 272.50 over the course of the next 2 weeks, a plunge of over 21% on December 14th, 2021! NVDA’s price then bounced into the FOMC meeting.
Big Tech stocks: What will they face in 2022?
What happened next had to do more with the FOMC and less with the Omicron variant (although the coronavirus was the root cause for almost all stock price moves since March 2020). At the December meeting, the FOMC surprised markets with its hawkish tone! Members discussed increasing the pace of bond purchases and forecasted 3 interest rate increases for 2022 and 3 interest rate increases for 2023! Nvidia is a monster semiconductor company which trades at a high valuation because its prospects for future growth/profits are high. However, if interest rates rise, the present value of those future profits falls, and so does that price of NVDA stock.
Central Banks: Liftoff in Focus?
As a result of more hawkish Fed, the markets were spooked and the price of NDVA moved lower t0 271.45. Price tried to bounce, but with the more hawkish Fed minutes yesterday, price again tested the near-term lows at 275.33. The series of lower highs and the testing of the lows has set up a falling triangle. Expectations are that price will break lower out of the falling triangle, which is often seen as a topping pattern. The target, once price breaks lower, is the height of the pattern added to the breakdown point. In this case, the target is near 200.00 and near the 61.8% Fibonacci retracement level from the lows of March 8th, 2021 to the highs of November 22nd, 2021.
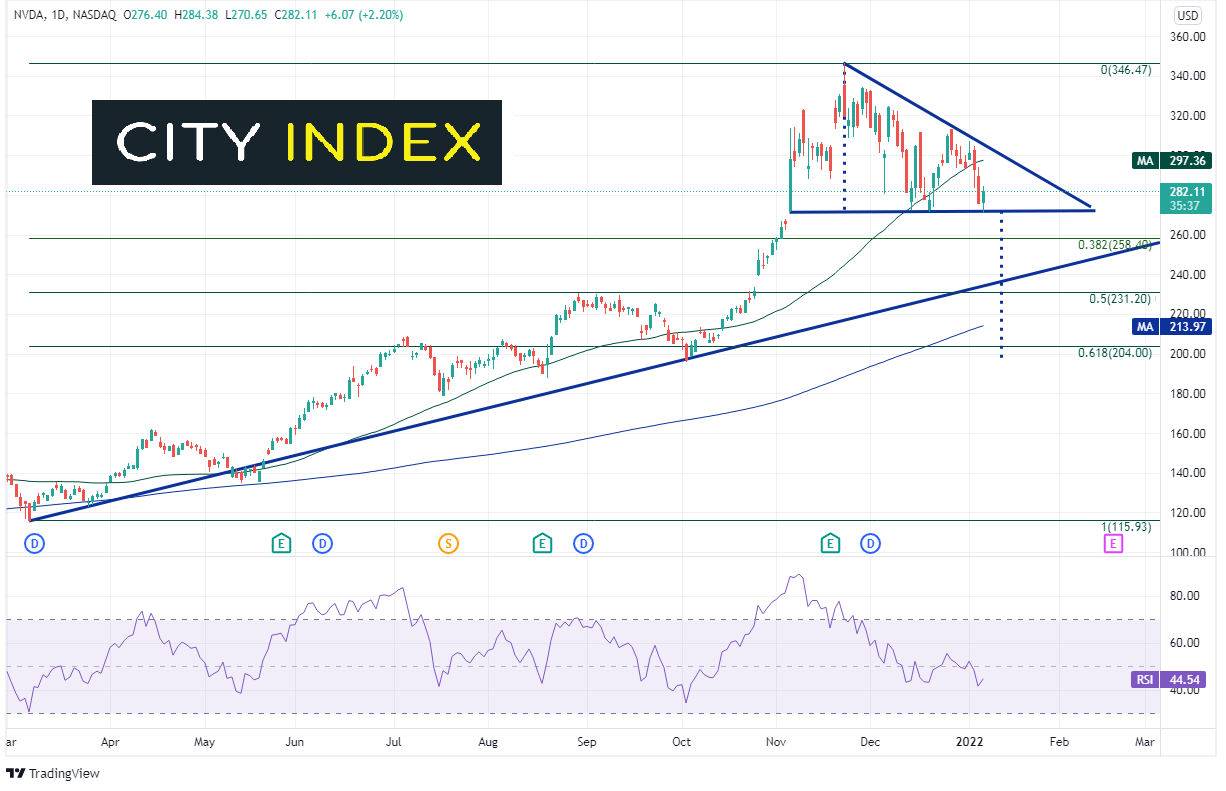
Source: Tradingview, Stone X
Trade NVDA now: Login or Open a new account!
• Open an account in the UK
• Open an account in Australia
• Open an account in Singapore
On a 240- minute timeframe, if price breaks below horizontal support at 270, it could fall to fill the gap from November 3rd, 2021 at 266.57 and then the 38.2% Fibonacci retracement from the lows on March 8th, 2021 to the highs of November 22nd, 2021 near 258.40. Below there is an upward sloping trendline dating back to March 8th, 2021 near 237. After that is a confluence of support at a gap fill, horizontal support and the 50% retracement from the previously mentioned timeframe near 230/233. Resistance is at the downward sloping trendline from the top of the triangle near 303.50. Above there is horizontal resistance at 313.90 and then the all-time highs at 346.47.
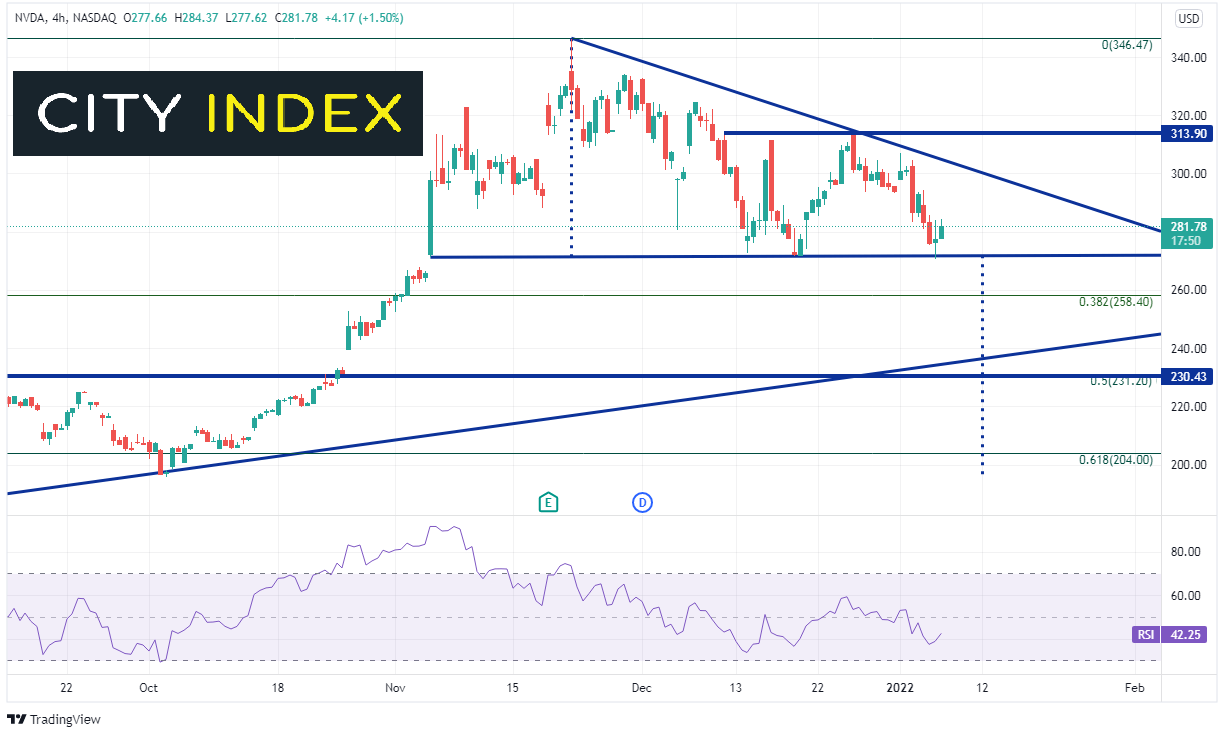
Source: Tradingview, Stone X
If the Fed aggressively increases interest rates over the next 2 years, the present value of Nvidia’s future value will continue to fall, and thus, so should the stock price. And if the stock breaks horizontal support near 270, it could be on its way to the topping pattern target near 200!
Learn more about equity trading opportunities.
Latest market news
Yesterday 01:32 PM
Yesterday 09:35 AM
Yesterday 07:23 AM
Yesterday 04:48 AM
Yesterday 12:17 AM
July 25, 2024 10:39 PM
Latest Nvidia Corp articles

June 20, 2024 01:22 PM

June 6, 2024 02:00 PM
May 23, 2024 01:13 PM

May 22, 2024 03:39 PM