

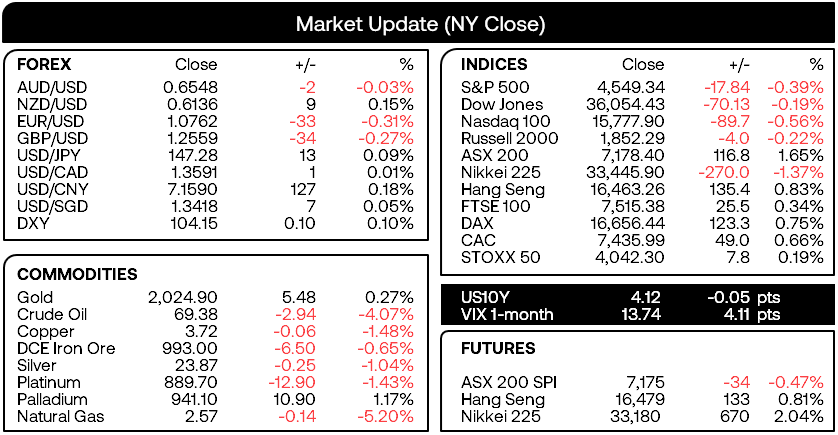
Market Summary:
- Further signs that US inflation is slowing showed up in cooler labour costs, which were reived to -1.3% q/q from 0.8%. ADP employment was also below expectations, adding just 103k jobs compared with 130k expected, and September’s figures were revised lower to 106k from 113k.
- This follows on from job openings which slowed to a 2.5-year low on Tuesday, as evidence for a soft landing – if not a recession – builds.
- The US dollar index was higher for a third day and closed marginally above its 200-day day EMA, as expectations for an ECB pivot (to cut rates) weighed on the euro and signs of a softer US economy sucked in safe-haven flows for the dollar.
- US economic data also weighed on Wall Street which saw a bearish engulfing day from on the S&P 500 and a 2-day bearish reversal pattern form on the Nasdaq 100. The question now is whether this is the beginning of a pullback we tend to see around this stage of the month, according to seasonality.
- The BOC held their cash rate at 5% as anticipated, although their statement removed their concern that inflationary risks are increasing. They retained a hawkish bias none the less, although admitted that their economy is no longer in excess demand.
- They’re more than likely done with hiking rates, but like many central banks they remain hesitant to declare their battle of inflation is over, having had their fingers burned by prematurely announcing a pause earlier in their tightening cycle (only to see inflation rise further).
- Australian GDP rose just 0.2% q/q, which adds to the calls that the RBA are done with hiking interest rates.
- Concerns over future demand due to a weaker economy and disappointment with the latest OPEC cuts continued to weigh on crude oil, which saw WTI close beneath $70 for the first time in nearly six months
- GBP/USD was lower for a third day, after the BOE said that interest rates are “likely to remain at these levels for an extended period”, pouring cold water on any further hikes in the foreseeable future.
Events in focus (AEDT):
- 09:00 – Australian manufacturing, construction index (AIG)
- 11:30 – Australian building approvals, trade balance
- 14:00 – China’s trade balance
- 16:00 – Japan’s leading index, coincident indicator
- 23:30 – US Challenger job cuts
- 00:30 – US jobless claims
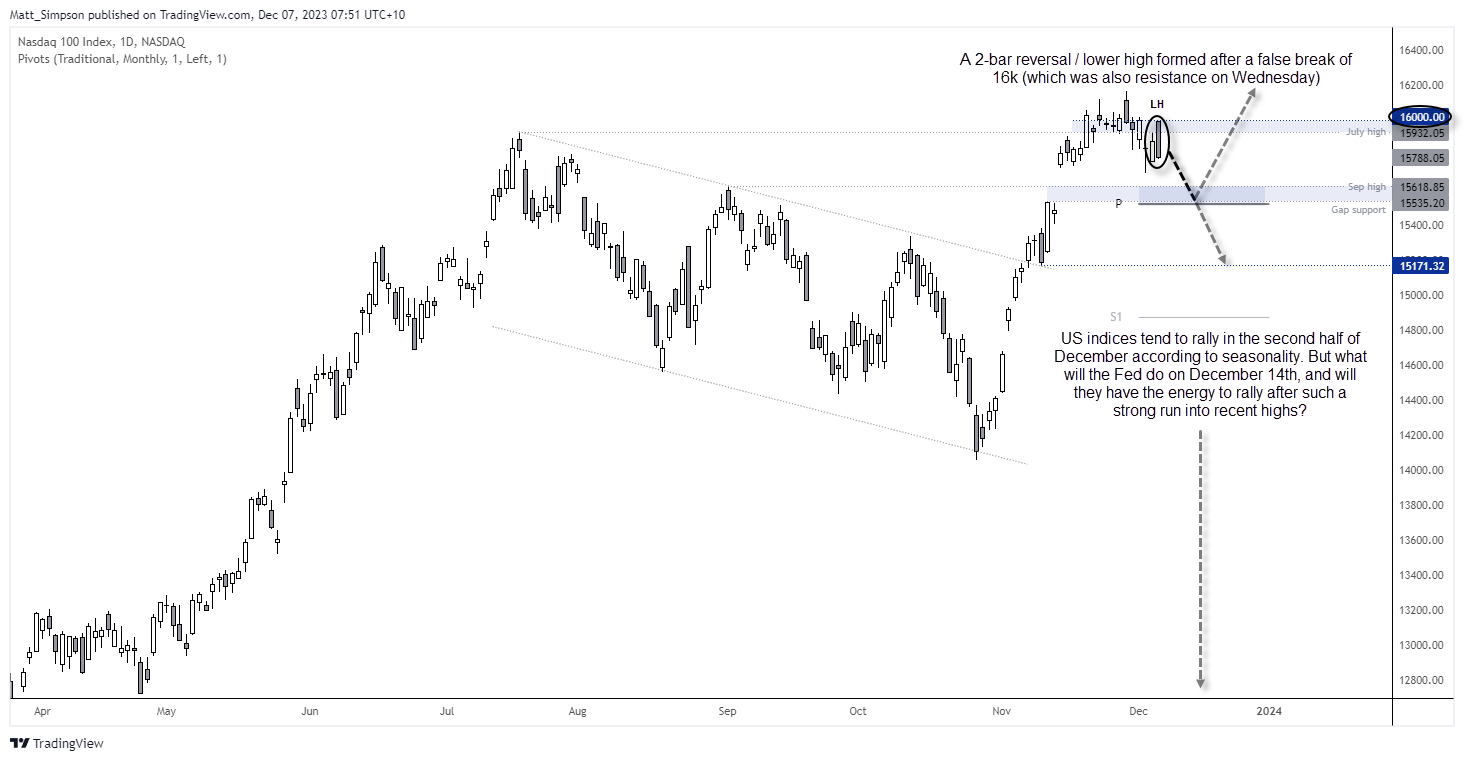
Nasdaq 100 technical analysis (daily chart):
Some interesting price action has been presented by the Nasdaq 100, as it plays suggests markets are trying to follow the seasonal pattern for US indices in December – which tend to top ~7th December until they rally ~16th December in the year end.
A 2-day bearish reversal pattern formed (dark cloud cover) which also formed a lower high, following a false break of 16k – which also acted as resistance on Wednesday.
A move towards the monthly pivot point / gap support / September high seems feasible from here. Although we may also need to see the S&P 500 break beneath 4540 for the move to unfold. And if it does, it could also suggest a deeper retracement for the Nasdaq ahead of its presumed rally in the second half of December, assuming Santa’s rally kicks into gear at all.
Related analysis: S&P 500 forecast - A closer look at 'Santa's rally'
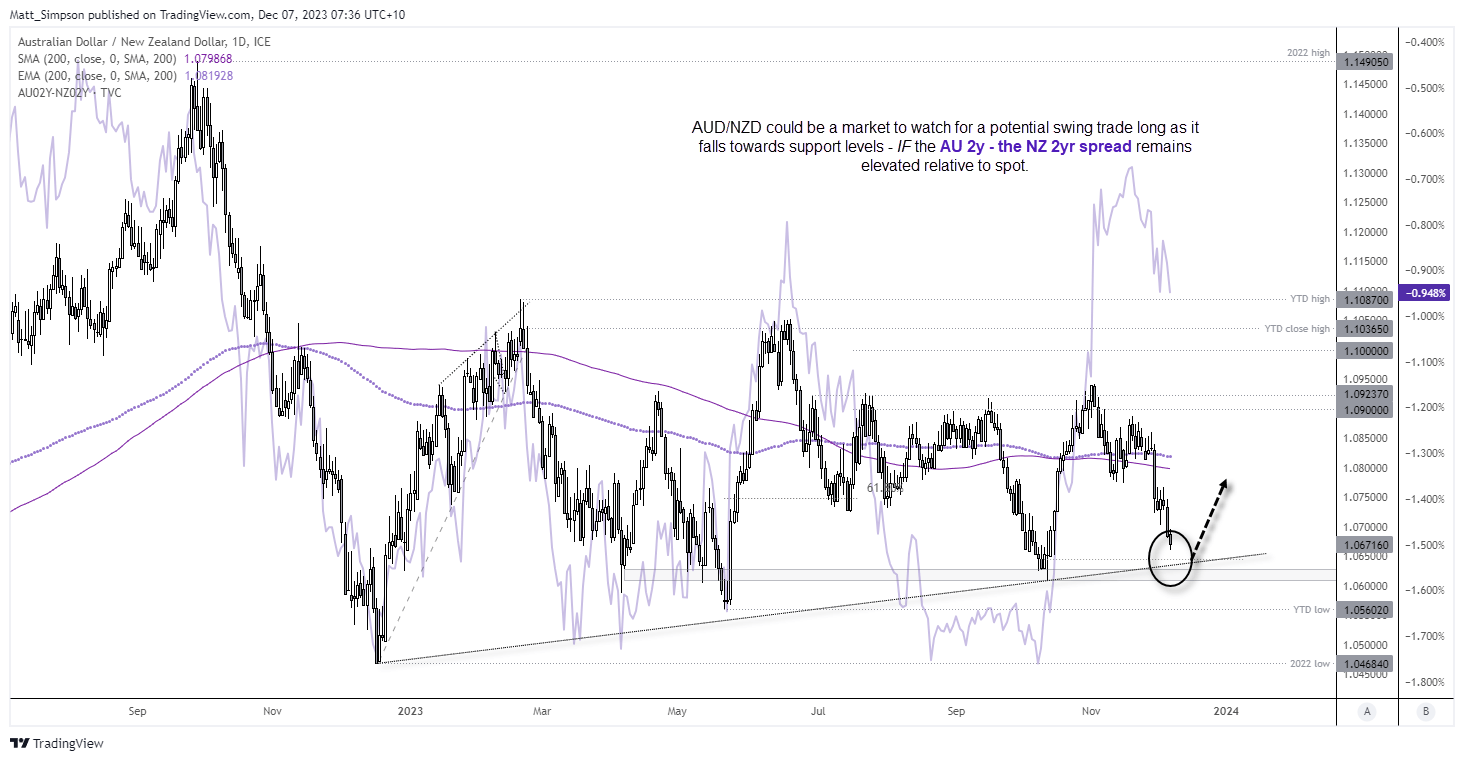
AUD/NZD technical analysis (daily chart):
Fundamentally, AUD/NZD is not exactly primed for a rally. Soft Australian GDP data renewed calls that the RBA are done hiking with a peak rate at 4.35%. And that makes the Australian dollar less attractive on a relative basis to NZD, as the RBNZ have the higher interest rate of 5.5% and recently delivered a hawkish pause.
However, AUD/NZD is falling towards a potential support zone around 1.06 – 1.065 which includes a rising trendline and cycle lows. And the AU 2yr – NZ 2yr differential remains elevated relative to spot. And that means Australian bond yields need to fall at a much faster rate relative to New Zealand’s to justify the current spot rate, or the AUD/NZD spot rate may indeed bounce. Just how a large a bounce we may see remains to be seen, but pairs such as AUD/NZD can present excellent swing trading opportunities once in a while, even if they fly in the face of fundamentals.
View the full economic calendar
-- Written by Matt Simpson
Follow Matt on Twitter @cLeverEdge
How to trade with City Index
You can trade with City Index by following these four easy steps:
-
Open an account, or log in if you’re already a customer
• Open an account in the UK
• Open an account in Australia
• Open an account in Singapore
- Search for the market you want to trade in our award-winning platform
- Choose your position and size, and your stop and limit levels
- Place the trade
Latest market news
Yesterday 01:32 PM
Yesterday 09:35 AM
Yesterday 07:23 AM
Yesterday 04:48 AM
Yesterday 12:17 AM
July 25, 2024 10:39 PM
Latest Asian Open articles

July 25, 2024 10:39 PM

July 24, 2024 10:10 PM

July 23, 2024 11:29 PM

July 22, 2024 10:43 PM