

Nasdaq 100 takeaways
- The Nasdaq 100 has benefitted from a strong earnings season, and now, optimism about a potential debt ceiling deal.
- After breaking out to a 1-year high, NDX bulls could look to take the index to 14,000 or 14,350 next.
- Longer-term, only a break back below 12,800 would shift the bullish bias.
Nasdaq 100 fundamental analysis
As we essentially wind down earnings season (Nvidia on Wednesday is the last major name to report), it’s clear that US corporations are good at their jobs. Broadly speaking, companies were able to raise prices to protect their margins, even if the raw quantities of goods and services sold stagnated.
The better-than-expected earnings season is combining with some optimism that we may soon see a debt ceiling agreement (or at least the first step on that path - a vote on a bill for an agreement) working its way through Congress early next week. If the signs continue to paint an optimistic picture, it would go a long way toward removing one of the biggest risk factors weighing on sentiment, potentially clearing the way for another leg up in risk-sensitive US indices like the Nasdaq 100.
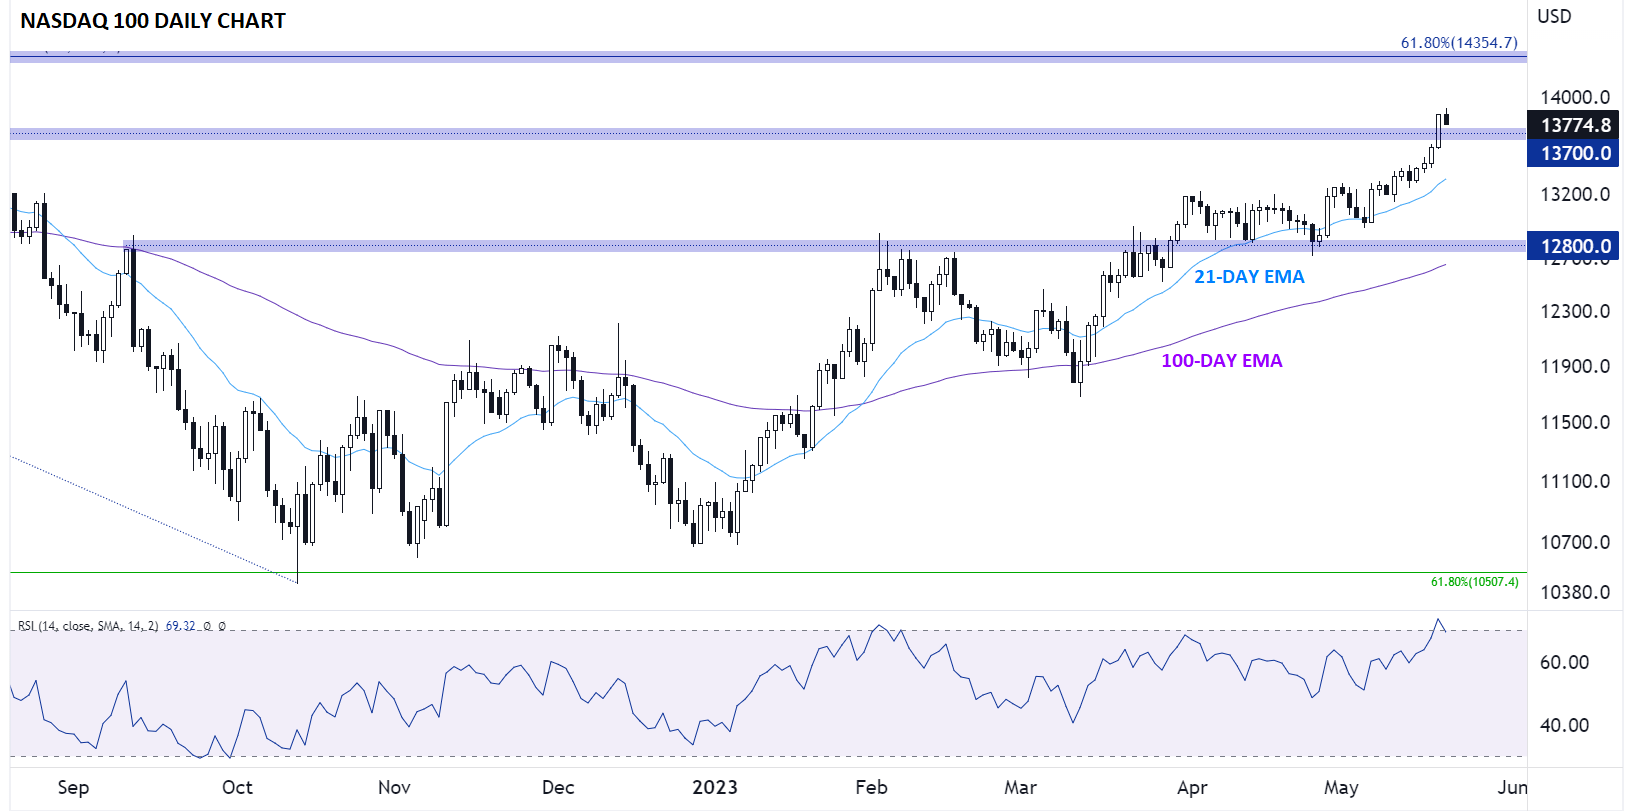
Nasdaq 100 technical analysis – NDX daily chart
Turning our attention to the chart, it’s clear that Nasdaq 100 traders are in a bullish mood this week. The tech-heavy index rallied the first four days of the week, culminating in a 2%+ surge yesterday to break out to a 1-year high above 13,700 yesterday.
So far today, prices are pulling back slightly, but after such a strong surge to start the week, a bit of profit-taking on the part of the bulls isn’t surprising. As long as the index manages to close the week above the breakout level of 13,700, that area should provide support heading into next week:
Source: Tradingview, StoneX
To the topside, the next level of resistance to watch is the round 14,000 handle, followed by the 61.8% Fibonacci retracement of the entire post-2021 bear market near 14,350. Meanwhile, a break back below 13,700 could raise the risk of a false break out, but in practice, would likely need to see a move below previous support and the rising 100-day EMA near 12,800 to erase the medium-term bullish bias.
-- Written by Matt Weller, Global Head of Research
Follow Matt on Twitter: @MWellerFX
How to trade with City Index
You can trade with City Index by following these four easy steps:
-
Open an account, or log in if you’re already a customer
• Open an account in the UK
• Open an account in Australia
• Open an account in Singapore
- Search for the market you want to trade in our award-winning platform
- Choose your position and size, and your stop and limit levels
- Place the trade
Latest market news
Yesterday 10:44 PM
Yesterday 05:00 PM
Yesterday 03:13 PM
Yesterday 01:39 PM
Yesterday 11:05 AM
Latest Indices articles

April 25, 2024 03:09 PM

April 25, 2024 03:00 PM
April 24, 2024 03:30 PM

April 18, 2024 04:46 PM