

Proponents of mean reversion believe that prices will correct back to the average when there’s a deviation from a trend. Learn more about mean reversion in trading and how to use it.
What is mean reversion trading?
Mean reversion is a theory in trading that suggests a market’s price will always revert to the long-running average of a given data set.
Therefore, values deviating far from the trend will tend to reverse direction and revert to the trend.
The investment theory works on the basis that there is an underlying trend in the price of an asset, but that the price can deviate from this in the short term, before correcting itself to the overarching trend. So, you’d buy (go long) when prices are below the average and sell (go short) when prices are above the average.
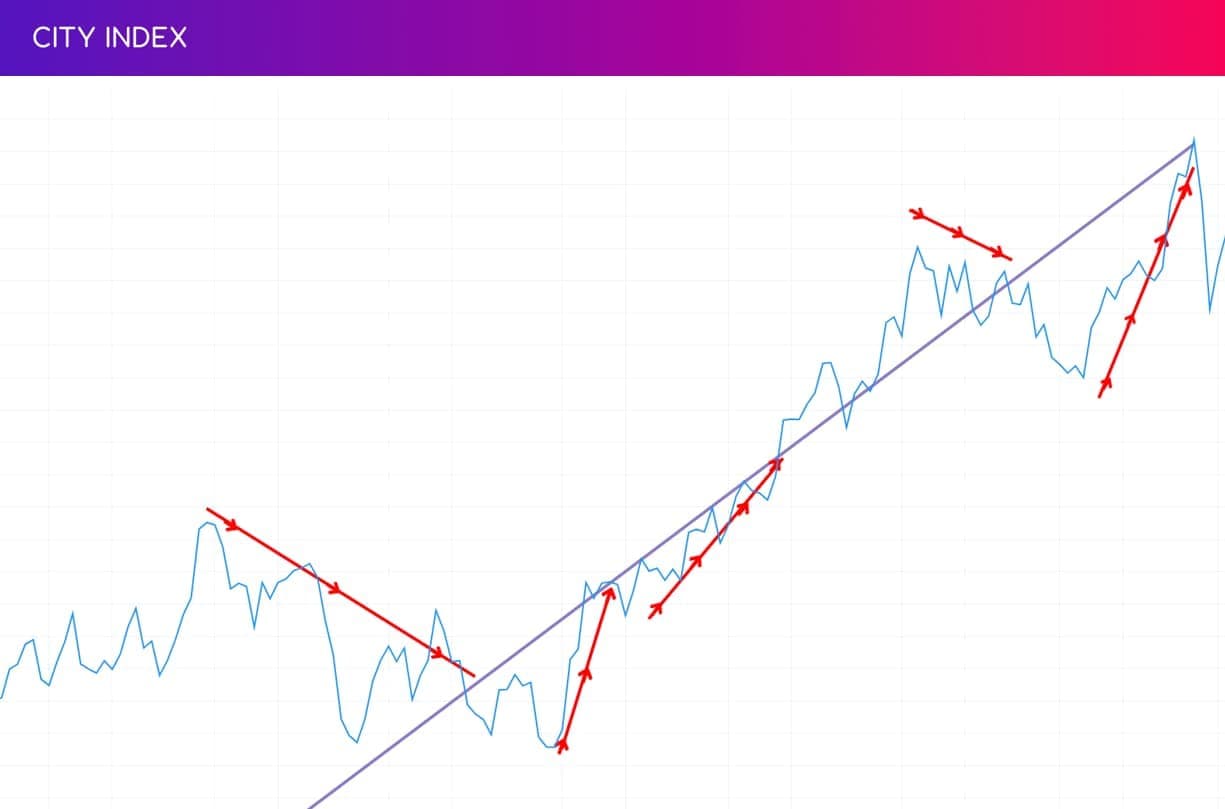
But it’s important to note that the mean is always changing too. So, prices won’t move to and from a set point. This requires traders to constantly adjust their strategies, which is why most traders build systems based on indicators which automatically project a mean, such as moving averages.
Some markets are considered more mean reverting than others. For example, the stock market typically trends upwards over time – it may have short-term bearish runs, but it will correct itself eventually. Whereas commodities are not considered mean-reverting assets, as they’re typically considered trending markets.
Mean reversion vs trend following
Most trading strategies are considered either mean reverting or trend following (also known as momentum trading).
Trend-following strategies are focused on capturing momentum – whether that’s up, down or rangebound.
So, whereas mean reversion strategies try to capture the movements to and from an average, trend traders will open a position in the general direction of a trend, holding their trade until the market reverses.
Does mean reversion work?
Many successful traders and investors do believe mean reversion works but it depends on your goals and style of trading.
Mean reversion doesn’t happen straight away, it can take a long time for the market to correct itself – if at all – so traders who use the method will need to be patient. That’s why it may not be suitable for extremely short-term styles of trading, such as scalping.
Because of this, mean reversion should form just one part of an overall trading strategy.
It’s also always important to analyse the asset in question thoroughly before taking a position. If there has been a change in the prospects for the market, then it’s less likely a mean reversion will occur. For example, if a profitable company announces a dire change in outlook, its share price is likely not going to recover until its growth gets back on track too.
The main argument against mean reversion is the efficient market hypothesis – or EMH. This theory states that the market price reflects all available information, so it’s impossible to outperform the market. So, when a stock’s price rises and falls there is a reason for it beyond just reverting to a mean.
Mean reversion trading strategies
There are a huge number of strategies that you can use to trade mean reversions. Here are two of the most popular.
Mean reversion pairs trading
Pairs trading is the strategy of finding two correlated assets that tend to move in tandem.
When prices deviate, traders can trade the reversal or correction back to the correlation – buying the asset that is undervalued relative to the other or selling the one that is overvalued. Once the price deviation has neutralised, the trader would close their position.
It’s also a common arbitrage strategy.
Mean reversion algorithmic trading
Algorithmic trading is a strategy that involves making decisions based on a set of rules that are then programmed into a computer to automate trades. The positions are executed as soon as the conditions are met.
A lot of mean reversion strategies use algorithmic elements, as automating the trades can cut out endlessly monitoring the market waiting for the correction to take place.
Mean reversion trading system
Most mean reversion trading systems are also built using indicators. Some of the best indicators for mean-reversion strategies are:
- Simple moving averages
- MACD
- Bollinger bands
Simple moving average
The most basic representation of a mean is a simple moving average (SMA). The SMA calculates the average price of an asset over a given timeframe. Once applied to a chart, the idea is that traders will see that the price tends to fluctuate around this line.
Building a trading system based on an SMA would require identifying how far away from the average the price has historically risen or fallen before reverting to the mean. You’d then look to take a position when the price moves by that many points again and exit once the mean is hit.
MACD
The moving average convergence divergence (MACD) is an extension of a moving average indicator. It’s considered a trend-following indicator, which as we know, is typically regarded as the opposite to mean reversion. However, knowing which direction the market is going to be heading next is a key part of mean reversion.
Traders have to be able to know when the market is going to revert to the mean because sometimes it can take a long time before a breakout corrects itself.
The MACD is made up of a fast exponential moving average (EMA) – which just means the more recent prices are given more weight than in a SMA – a slow EMA, and a zero line. One of the most common ways to trade with the MACD is to wait for the fast EMA to cross above the slow EMA for a buy signal (to enter a long position) or for the fast EMA to cross below the slow EMA for a sell signal (to enter a short position).
Bollinger bands
Bollinger bands are another useful part of a mean reversion trading system. They use standard deviations to assess how far away from the average the current price is.
A trader could assume that the further away the standard deviations are, the more likely the price is to revert to its mean.
How to trade mean reversion
To start using mean reversion strategies with City Index, follow these steps:
- Open your City Index account and add some funds
- Log in to our award-winning Web Trader platform or download our mobile trading app
- Watch for a deviation from the mean using our range of indicators on industry-leading TradingView charts
- Choose to ‘buy’ to go long, or ‘sell’ to go short
Alternatively, you can buy and sell our full selection of stocks, indices, forex, commodities and more with a City Index demo account.
This is a great option for traders who want to practice identifying mean reversion opportunities first without putting up any capital – instead, you’ll be trading with virtual funds and zero risk.
Latest market news
Yesterday 01:32 PM
Yesterday 09:35 AM
Yesterday 07:23 AM
Yesterday 04:48 AM
Yesterday 12:17 AM
July 25, 2024 10:39 PM
Latest Stocks articles

July 18, 2024 11:35 AM

June 13, 2024 02:00 PM

June 6, 2024 02:00 PM
June 2, 2024 08:00 AM