

The head and shoulders chart pattern is one of the most popular technical analysis tools, giving crucial insight into upcoming market reversals. Learn how to trade the head and shoulders pattern.
- What is the head and shoulders pattern?
- What is the inverse head and shoulders pattern?
- How to trade the head and shoulders pattern
- Start trading head and shoulders patterns
- Head and shoulders examples
- Head and shoulders FAQs
What is the head and shoulders pattern?
The head and shoulders pattern is a chart formation that signals an impending bearish reversal. It is typically formed over several sessions, getting its name because it resembles a head with a shoulder on either side of it.
A head and shoulders chart pattern is made up of three distinct moves:
- First, the market rises and hits a new peak, but then retraces back to a support line (often referred to as the neckline)
- The market then rallies once more – but falls again, back to the original support line
- After a final push up close to the height of the first peak, the market falls for a third time. This time, breaking through the support line and kickstarting a new downtrend
Some traders find it easier to visualise as a mountain comprised of three peaks, with two troughs in the middle.
The head and shoulders pattern is seen as a fairly reliable indicator of impending reversals. This makes it highly sought after among traders, as identifying when a bullish market is about to reverse can be crucial to timing your exits and entries.
However, the head and shoulders pattern doesn’t have any rules regarding how long it takes to form – so you might need to monitor your chosen market for a while before you can open a trade. For more short-term patterns, check out our Japanese candlestick patterns cheat sheet.
What is the inverse head and shoulders pattern?
The inverse head and shoulders pattern is the exact opposite of the head and shoulders. It appears after downtrends and signals the onset of a bullish reversal – but only after the market has carved out three distinct lows.
The inverse head and shoulders looks exactly like an upside down head and shoulders:
- The market hits a new low, then recovers up to a resistance line
- It then plunges even further, but again recovers to the resistance line
- The final low matches the first, but this time the resistance line is broken and a new uptrend forms
As with the classic head and shoulders, it is seen as a good indicator of bullish reversals, making it a popular pattern among technical traders.
Read more about chart patterns.
How to trade the head and shoulders chart pattern
Most traders aim to use the new trend formed after the final breakout as the basis of their strategy. While it is possible to trade within the price action of the pattern itself, you’ll be relying on indicators and other tools.
To build a head and shoulders trading strategy, you’ll need to consider when you want to enter your position, where to place your stop and how much profit to target.
Entering your head and shoulders trade
As with any pattern, you’ll want to confirm that your trend is underway before you open your position. So, traders will wait for a session or two after the breakout, watching the market to ensure that the trend has started.
If you’re trading a standard head and shoulders, you’ll want to confirm with a couple of red candlesticks. With an inverse one, you’ll want them to be green.
You can also use indicators to confirm your trend. The RSI and stochastic oscillator, for example, can tell you whether momentum has shifted.
Setting your stop loss
The general rule of thumb with a head and shoulders is to use the right-hand final shoulder to place your stop loss.
- On a standard pattern, you’d place the stop slightly above the peak of the right shoulder
- On an inverse head and shoulders, you’d place the stop slightly below the lowest point of the shoulder
There may be some consolidation before the breakout, so placing your stop there gives the position time to breathe before your trade is closed out. However, if you wish you can place your stop loss closer.
Choosing a profit target
Most traders measure the distance between the pattern’s highest point (the top/bottom of the head) and its lowest point (the neckline) and use that as the profit target for the move from the breakout.
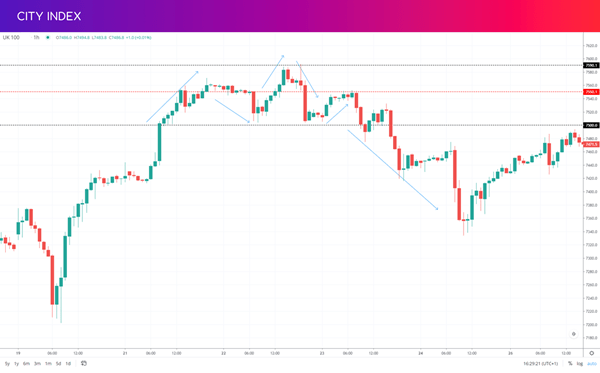
For example, if you spot a head and shoulders on the FTSE 100 (UK 100) with a head at 7590 and a neckline at 7500, you might target 90 points of profit from the downward breakout.
Using the height of the pattern and the top of the final shoulder also enables you to calculate your risk-reward ratio. Say, for instance, that our FTSE pattern above has a right shoulder that tops at 7550:
- Our total risk from the neckline breakout to the right shoulder is 50 points
- Our total potential profit is 90 points
- Our risk-reward ratio is 50-90, 5-9 or close to 1-2
As you can see below, the market fell well below the price target, offering potential further upside to the position.
Start trading head and shoulders patterns
To start trading head and shoulders patterns with City Index, follow these steps:
- Open your City Index account and add some funds
- Log in to our award-winning Web Trader platform or download our mobile trading app
- Search for head and shoulders patterns on industry-leading TradingView charts
- Choose to buy to go long, or sell to go short
Alternatively, you can buy and sell our full selection of stocks, indices, forex, commodities and more with a City Index demo account, which gives you virtual funds to try out trading on live markets with zero risk. This is a great option for beginner technical traders, as it helps you plan your strategy without putting up any capital.
Head and shoulders pattern examples
Let’s look at a couple of examples of head and shoulders patterns to see how they work on real markets.
Example 1: EUR/USD head and shoulders
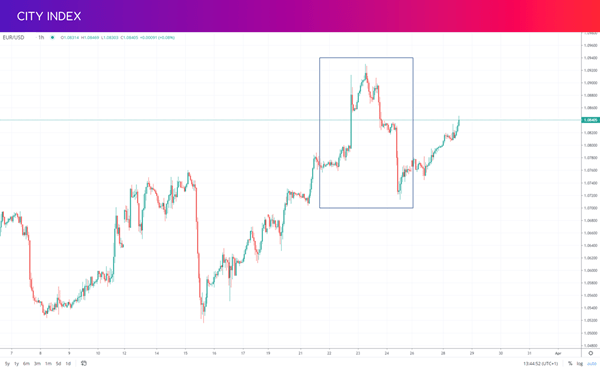
Here, we can see a head and shoulders form on a one-hour EUR/USD chart after a sustained uptrend. The long green candle shows a final burst of upward momentum, peaking at 1.0910. We then see a retreat to the neckline at around 1.0860, followed by a new peak above 1.0920.
After another trough, the second shoulder comes close to matching the height of the first, before a dramatic break through the neckline sets off a downtrend.
Here’s how a trade on this pattern might look:
- Entry: 1.0860
- Stop: 1.0900 (40 points away)
- Limit order: 1.0800
- Profit target: 60 points
- Risk-reward: 2:3
Again, this move presented the opportunity to let profits run to 1.0725, a potential profit of 135 points.
Example two: DAX inverse head and shoulders
Now let’s examine an inverse head and shoulders example.
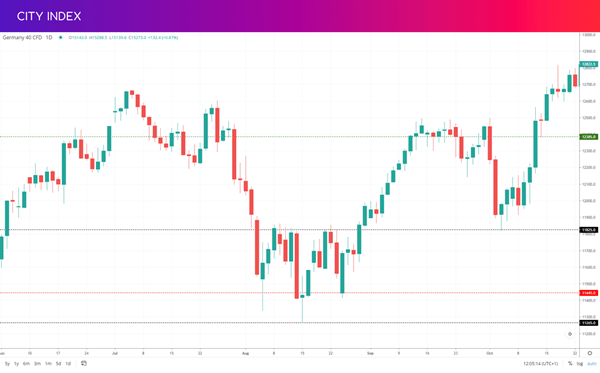
Here, the DAX (Germany 40) enters a medium-term bear run on its one-day chart. It sinks to 11,445 on the first shoulder, recovers to a neckline of 11,825 then plunges to a new low of 11,265. The second shoulder roughly matches the first, and triggers a breakout above the neckline to a recovery.
- Entry: 11,825
- Stop: 11,445 (380 points away)
- Limit order: 12,385
- Profit target: 560 points
- Risk-reward: 2:3
As we can see, this time the height of the pattern provided a rough framework for the initial uptrend. The market stalls shortly after hitting our limit order before the bull move resumes sometime later.
Head and shoulders trading pattern summed up
- The head and shoulders pattern signals a possible impending bearish reversal – meaning it appears at the end of uptrends, as a sign that a bear run may be about to take over
- The inverse head and shoulders is the opposite, appearing at the end of downtrends
- Most traders will use the resulting break out through the neckline as their trading opportunity
- Generally, you’ll place your stop near the tip of the right-hand shoulder
- You can use the height of the pattern from the neckline to the top of the head as an indication of total potential upside
- To trade head and shoulders patterns, you’ll need a City Index account
- Or you can trade risk-free with a trading demo
Head and shoulders pattern FAQs
Which markets can I trade head and shoulders patterns on?
You can trade head and shoulders patterns on most markets, including forex, stocks, indices and commodities. This versatility makes it a popular option among traders, and a cornerstone of many technical analysis trading strategies.
How reliable is the head and shoulders pattern?
The head and shoulders pattern is seen as a reasonably strong indicator of upcoming bearish reversals (or bullish reversals, for an inverse head and shoulders). However, it isn’t foolproof so confirming the onset of the trend and using stop-loss orders is still necessary.
Is the head and shoulders trading pattern bullish or bearish?
The head and shoulders pattern gives a bearish trading signal – but crucially, only when the formation completes with a breakout beneath the neckline. Without the breakout, a head and shoulders is neutral.
The inverse head and shoulders, meanwhile, is a bullish signal. But again, only once the breakout has actually taken place.
Latest market news
Today 07:49 AM
Yesterday 01:39 PM
Latest Financial market insight articles
March 26, 2024 04:11 AM

November 16, 2023 10:23 AM

November 13, 2023 11:05 AM

October 25, 2023 01:45 PM