
S&P500 Forecast: SPX rebounds as big tech recovers & inflation is in focus
Article
Today 2:32 PM

Both the relative strength index (RSI) and stochastic oscillator help traders identify whether an asset is overbought or oversold. Let’s take a look at each indicator and how you can use them to enter or exit a position.
The relative strength index (RSI) is a momentum indicator used to find the strength of recent price movements. It essentially measures the speed at which buyers are buying and sellers are selling, and the extent of the price change.
The RSI compares the average number of days that an instrument closes up to the average number of days that it closes down. This average is then rated on a scale of 1 to 100.
It is an oscillator, so it’s plotted beneath the price chart. It can be used on multiple timeframes ranging from minutes to hours, days and even weeks. The common timeframe is 14 days, but longer-term traders might choose to set their charts to a weekly view and use 14 weeks instead.
The RSI is calculated by taking the average gain and loss over a 14-day period. You’d do this by finding the average upward change in a market and the average downward change in a market, over a 14-day period
To show this figure between 0-100, you need to ‘normalise’ the figures. This is shown in the following formula:
RSI = 100 – [100 / (1 + (average of gains/average of losses)]
Typically, RSI is used with a 9, 14, or 25 calendar day (7, 10, or 20 trading day) period against the closing price of an instrument. If you add more days to the calculation, the value is considered less volatile.
The RSI can be used to find overbought or oversold situations, or it can be used to find divergences. It is important to understand that these signals are not 100% accurate and do not always work or provide valid signals.
Oversold conditions
An RSI reading below 30 suggests that a market is oversold. This may indicate that a downtrend has reached an exhaustion point and a reversal could be at hand. If the RSI reading is below 30 and rising, then traders may use this is a potential signal that the market price will reverse and start trading higher.
Overbought conditions
A reading above 70 suggests that a market is overbought. This happens when the market has rallied and reached a point of resistance. If the RSI has reached above 70 and then starts to fall, we may see a situation where the market could reverse and head lower.
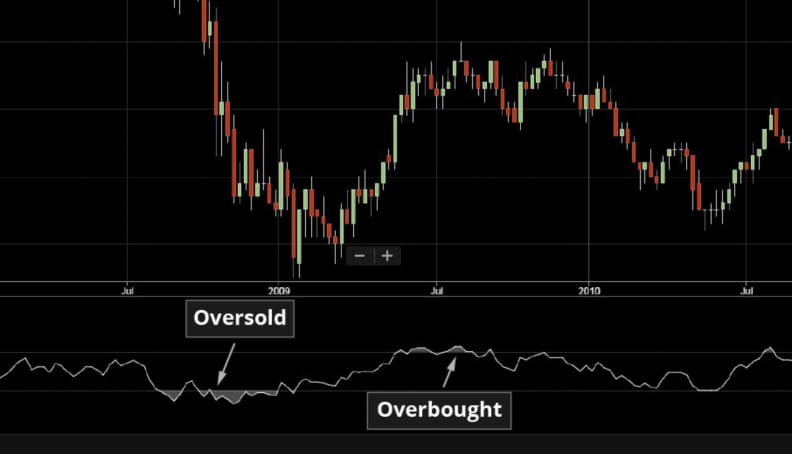
The stochastic oscillator compares the closing price of an instrument to its price over a certain period of time. This can then be used to determine overbought or oversold conditions and forecast possible entry or exit points.
The stochastic oscillator can be used on multiple timeframes ranging from minutes, hours, days and weeks. Common timeframes are daily for short-term traders and weekly for longer-term traders. Some traders use the stochastic oscillator on intraday timeframes charts to capture very short-term moves lasting from minutes to hours.
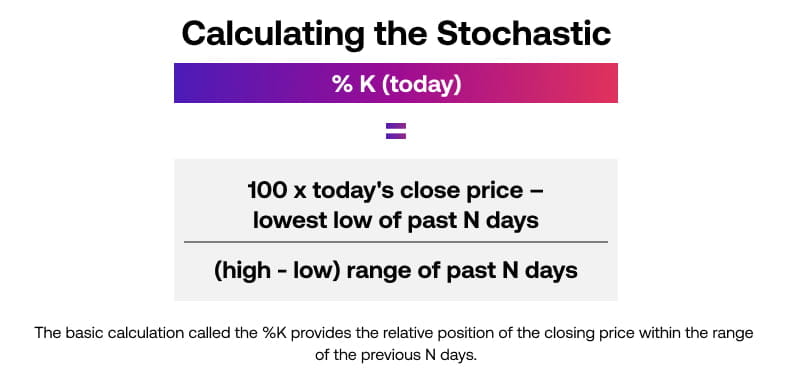
The stochastic oscillator measures whether an instrument is overbought or oversold by analysing how long it can maintain its current trend. This uses two lines, the %K and %D, which appear on a sub-chart below the price chart.
The %K provides the relative position of the closing price within the range of the previous days. The range is the highest high of the past number of days (not including today) minus the low of the past number days (not including today). Dividing by the range creates a value from 0 – 100.
The stochastic oscillator is most commonly used to find overbought or oversold situations.
Oversold conditions
A reading of 20 and below is considered as oversold.
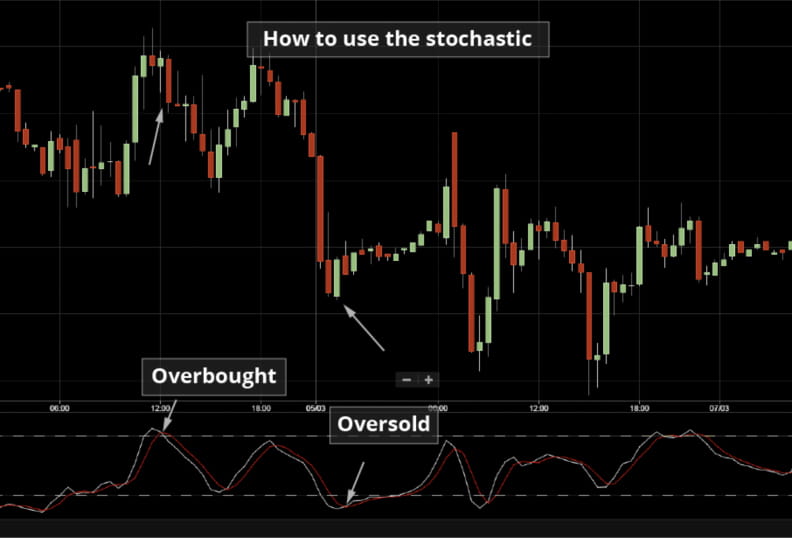
A trader would wait for the indicator to cross up from below 20 – and also for the %K to cross above the %D – as confirmation to buy the market.
Overbought conditions
Stochastic readings above 80 are regarded as a sign of the market being overbought.
If the stochastic indicator falls below 80 – and the %K crosses below %D – this would be seen as confirmation to sell the market.
Divergence
It can also be used as a tool to find situations where a divergence takes place which is similar to the MACD indicator. A divergence occurs when momentum is going in one direction and the price in another. Should the stochastic oscillator fail to confirm momentum is going in the same direction as the price, it could indicate a reversal.
Remember, these signals are not guaranteed, as markets can be affected by a variety of factors.