

- EUR/USD analysis: Bullish price structure ahead of US CPI
- FTSE analysis: UK’s benchmark stock index finally breaks out
- ETH/USD analysis: Could Ether follow Bitcoin in achieving a new record?
Welcome to another edition of Technical Tuesday, a weekly report where we highlight some of the most interesting markets that will hopefully appease technical analysts and traders alike. In this week’s report, we will analysis the EUR/USD, FTSE and Ether following recent bullish price action in all these markets.
Financial markets are awaiting the release of US CPI, due at 12:30 GMT. But markets are in a bullish mood, with European stocks and US futures on the rise, suggesting that investors are not expecting to see a hotter-than-expected inflation report this time around. In Europe, basic resources and banks were leading the charge, plenty of which found in the FTSE 100 index. The UK benchmark index was looking technically strong and could be the latest global index to hit a new record high in the coming days.
EUR/USD analysis: Bullish price structure ahead of US CPI
Ahead of the release of US CPI, the EUR/USD has been consolidating its recent gains, mirroring other major FX pairs. The world’s most heavily traded pair looks poised to break out and reach 1.10 handle from here, unless something dramatic happens that causes a massive shift in the dollar’s trajectory. At the time of writing, the EUR/USD was testing and holding above a key support area starting around 1.0920 to around 1.0885. This area is shaded in light blue on my chart and marks a prior resistance range.
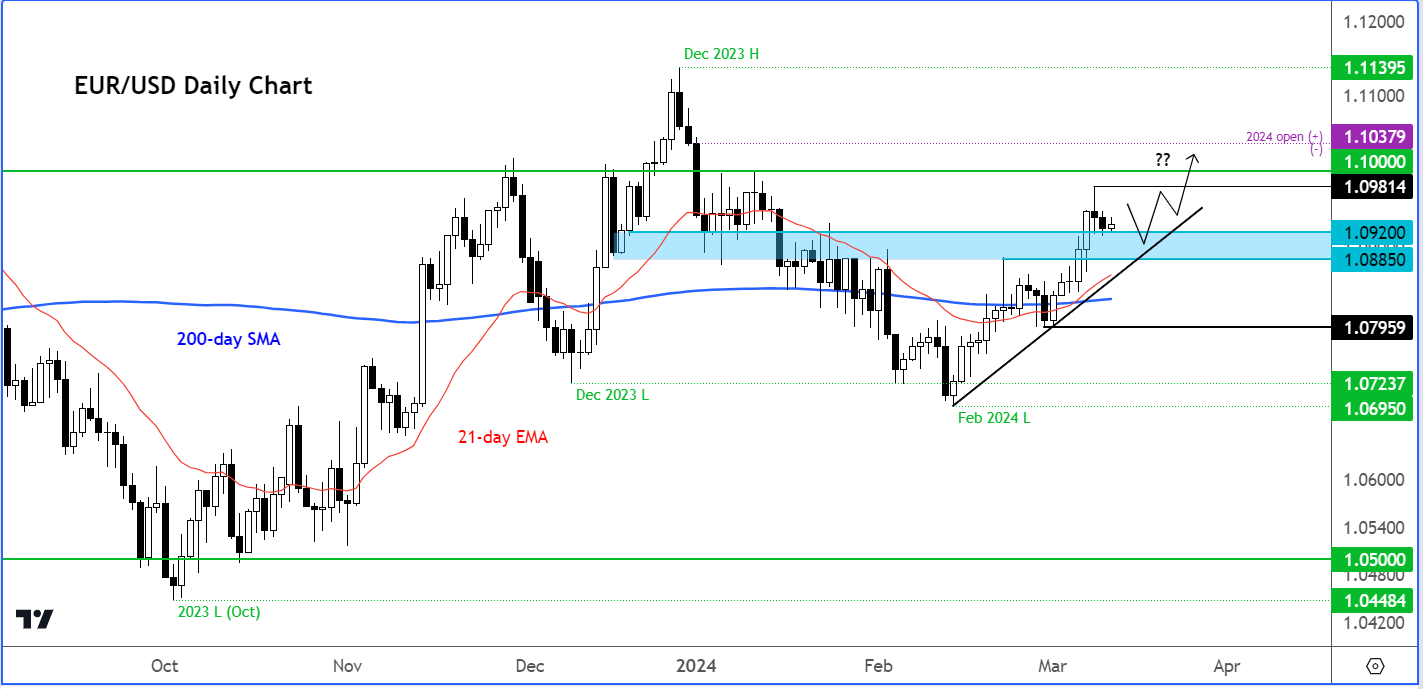
The underlying trend is clearly bullish insofar as the short-term is concerned, with price above both the 21-day exponential and 200-day simple moving averages. There’s also a short-term bullish trend line established that goes back to February. If the recent bullish trend continues then 1.1000 could be the next upside objective, followed by the December’s high of 1.1140 thereafter.
FTSE analysis: UK’s benchmark stock index finally breaks out
Yesterday, I highlighted the potential for a breakout in the FTSE, thanks to rising commodity prices and a firmer Chinese equity market.
Well, today the index has risen relatively sharply, adding to its gains made the day before. In the process, the FTSE has broken above both the 7685/90 resistance level and the bearish trend line of its consolidation pattern. A daily close around current levels or higher would point to further follow-up technical buying in the days ahead.
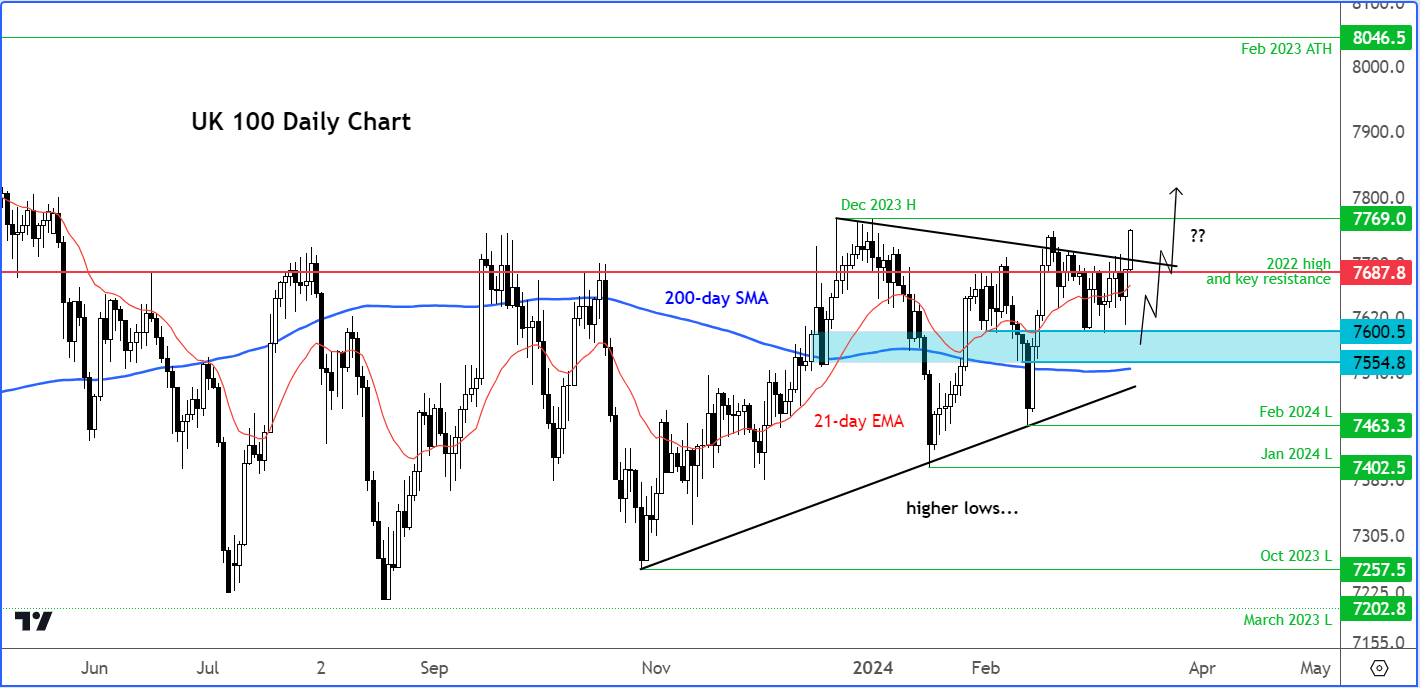
Now that we have broken above the old 7685/90 resistance area, this zone is now the key area that the bulls will need to defend on any potential retracement. For as long as they hold their ground above this zone, the path of least resistance would remain to the upside.
From here, the bulls will be eyeing December’s high of 7769 next. Above that level, there won’t be many other reference points to watch until the February 2023’s record high at 8046 next. Could we get there in the next few days? I wouldn’t bet against it given how global markets have rallied this year.
ETH/USD analysis: Could Ether follow Bitcoin in achieving a new record?
Stocks indices are not the only assets hitting record highs. Gold and Bitcoin have recently rallied to unchartered territories on peak interest rates narrative. Now, the second largest crypto by market capitalisation could be on the verge of a breakout to a new all-time high.
Source: TradingVIew.com
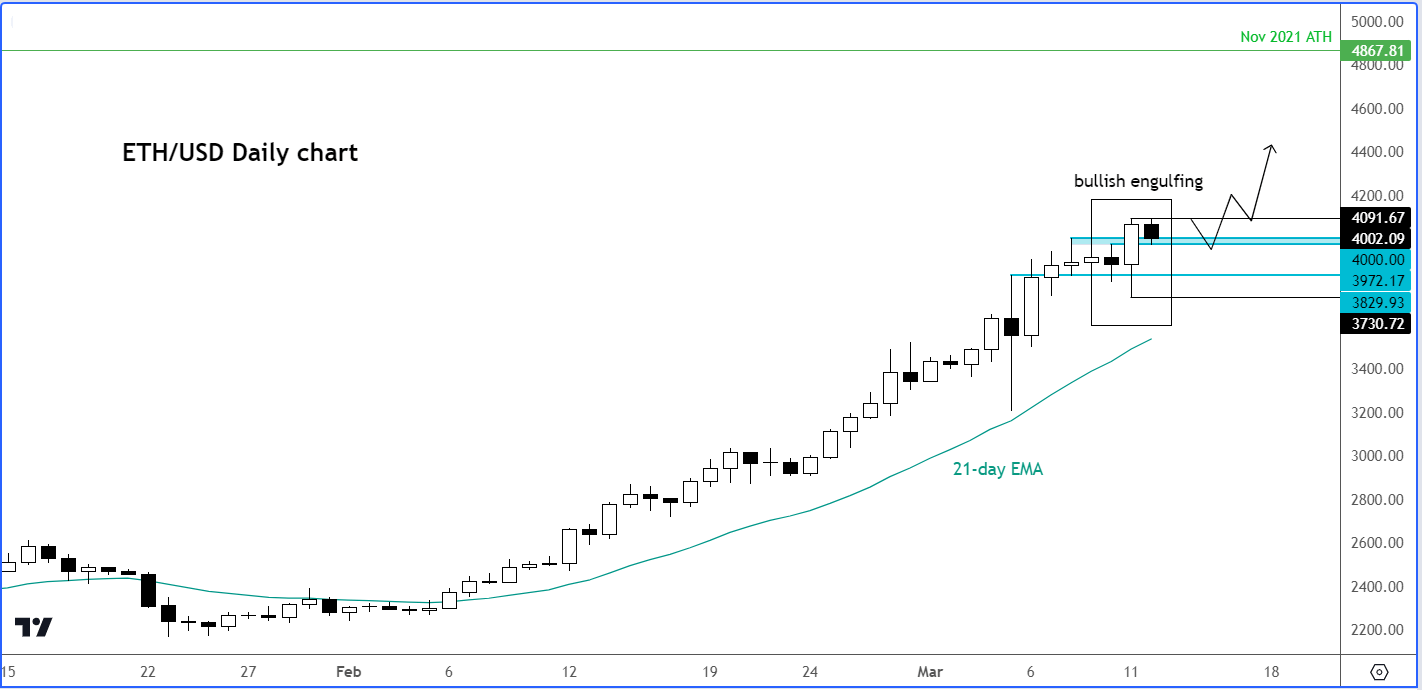
ETHUSD formed large bullish engulfing candle on its daily chart on Monday, after recovering from a weaker start to close above the key $4,000 level. Monday’s range completely engulfed price action since Thursday. With $4,000 broken, today’s weakness could once again be faded as price tests this former resistance and psychological level. If so, a move above Monday’s high at $4091 could be on the cards next. But potentially, we could see Ether go on to rise all the way to the November 2021’s record high of $4867 in the coming days and weeks.

Gold and silver technical analysis video
-- Written by Fawad Razaqzada, Market Analyst
Follow Fawad on Twitter @Trader_F_R
How to trade with City Index
You can trade with City Index by following these four easy steps:
-
Open an account, or log in if you’re already a customer
• Open an account in the UK
• Open an account in Australia
• Open an account in Singapore
- Search for the company you want to trade in our award-winning platform
- Choose your position and size, and your stop and limit levels
- Place the trade
Latest market news
Yesterday 01:32 PM
Yesterday 09:35 AM
Yesterday 07:23 AM
Yesterday 04:48 AM
Yesterday 12:17 AM
July 25, 2024 10:39 PM
Latest Technical Tuesday articles

July 23, 2024 05:20 PM

July 16, 2024 03:17 PM

May 14, 2024 06:00 PM
April 23, 2024 04:00 PM