

Asian Indices:
- Australia's ASX 200 index fell by -70.3 points (-0.97%) and currently trades at 7,163.70
- Japan's Nikkei 225 index has fallen by -31.87 points (-0.12%) and currently trades at 27,426.02
- Hong Kong's Hang Seng index has fallen by -334.49 points (-1.57%) and currently trades at 20,960.45
- China's A50 Index has fallen by -54.67 points (-0.4%) and currently trades at 13,505.45
UK and Europe:
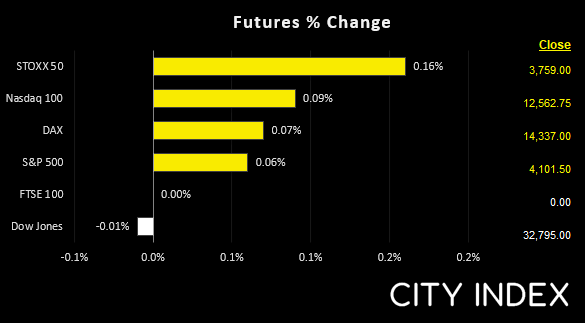
- UK's FTSE 100 futures are currently down 0 points (0%), the cash market is currently estimated to open at 7,532.95
- Euro STOXX 50 futures are currently up 6 points (0.16%), the cash market is currently estimated to open at 3,765.54
- Germany's DAX futures are currently up 10 points (0.07%), the cash market is currently estimated to open at 14,350.47
US Futures:
- DJI futures are currently down -2 points (-0.01%)
- S&P 500 futures are currently up 12.5 points (0.1%)
- Nasdaq 100 futures are currently up 2.75 points (0.07%)
Oil prices took a bit of a knock overnight after the Financial Times reported that Saudi Arabia may be willing to increase their production if Russia’s oil output falls substantially. WTI and brent fell as much as 2.5% earlier in the session before holding key support levels. And those markets will remain in focus around today’s OPEC meeting for any potential surprise deviation from the expected 432 bpd production increase from OPEC+ members.
Equity markets were lower overnight as investors renewed their concerns over central bank tightening. The Hang Seng was the worst performer and currently trades around -1.7% lower.
DAX 1-hour chart:
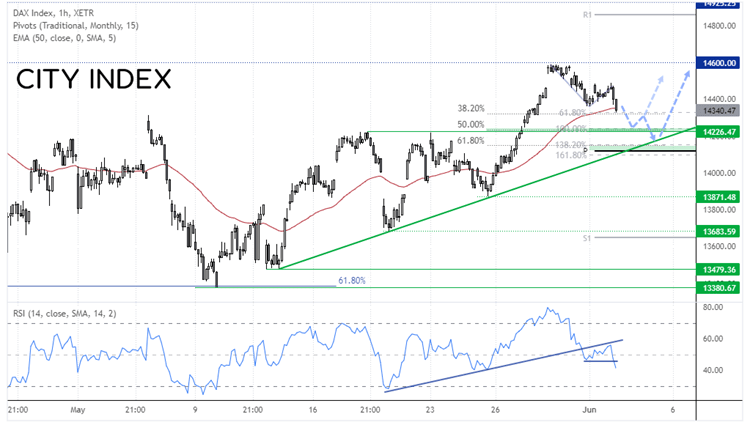
The DAX closed lower for a second consecutive day after softer PMI data for Europe. It reached our initial target around 14,600 and has since tracked Wall Street lower and shows the potential for a slightly deeper retracement over the near-term, even though we remain bullish overall.
The hourly chart shows that it is within the third wave of a retracement, RSI is below 50 and confirming bearish price action. However, there’s no bearish divergence on the 4-hour RSI or daily RSI, which is why we think this is still part of a correction.
Potential support levels for bears to target (or bulls seek long opportunities) are around 14,315, 14,225 and 14,150 where Fibonacci clusters reside (and trend support and the monthly pivot point at the lower support level).
DAX 30 trading guide
EUR/USD 4-hour chart:
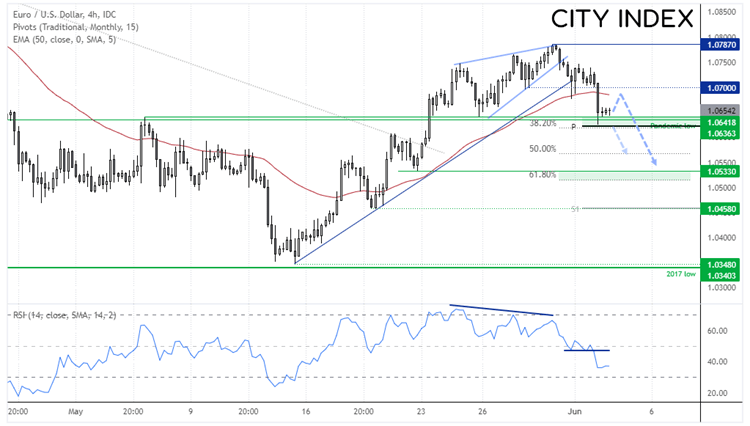
A combination of stronger PMI data for the US and weaker data for Europe sent EUR/USD to a 7-day low overnight. A bearish divergence was forming on the 4-hour chart before the market struggled to test 1.0800, then broke a bullish trendline to warn of a reversal. The RSI is now below 50 and confirming price action.
However, there are some strong support levels around 1.0635/50 including the 38.2% Fibonacci retracement, monthly pivot point and swing highs. We suspect price could bounce from current levels before printing a new lower high then breaking below the key support zone and move towards 1.0530 support. Alternatively, a direct break below 1.0630 assumes bearish continuation.
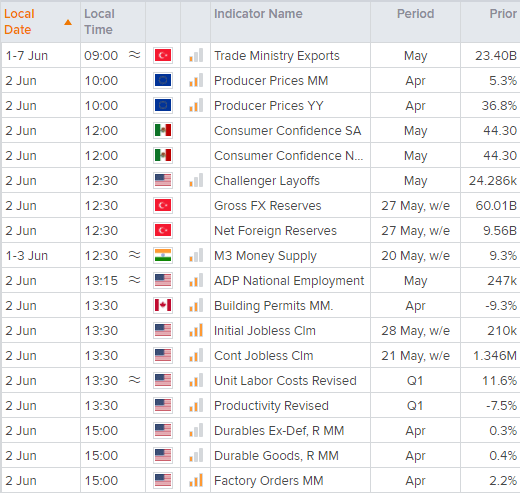
Up Next (Times in BST)
How to trade with City Index
You can easily trade with City Index by using these four easy steps:
-
Open an account, or log in if you’re already a customer
• Open an account in the UK
• Open an account in Australia
• Open an account in Singapore
- Search for the company you want to trade in our award-winning platform
- Choose your position and size, and your stop and limit levels
- Place the trade
Latest market news
Yesterday 01:32 PM
Yesterday 09:35 AM
Yesterday 07:23 AM
Yesterday 04:48 AM
Yesterday 12:17 AM
July 25, 2024 10:39 PM
Latest Forex articles

Yesterday 12:17 AM

July 25, 2024 10:39 PM

July 25, 2024 03:59 PM

July 25, 2024 04:37 AM