

Market Summary:
- The ECB raised rates by 25bp, but took the surprising decision to (effectively) announce the end of their hiking cycle in their statement, even if Lagarde later denied it. Given the ECB continue to fight inflation, it could suggest the ECB are more concerned with the risking risks of a recession over higher prices (as a recession would presumably lead to lower prices anyway)
- Staff forecasts raise their CPI target to 3.2% in 2024 and 2.1% in 2025 due to higher expected energy costs.
- And whilst core CPI was revised lower, at 2.9% in 2024 and 2.2% in 2025, it still remains above the ECB’s target for the next couple of years.
- US data also exceeded expectations, with retail sales, producer prices and jobless claims all beating forecasts. Whilst this keeps the pressure on the Fed to keep rates higher for longer, it also helped keep alive the ‘soft landing’ narrative for the US economy
- Retail sales rose 0.6% (0.2% expected, 0.5% prior), producer prices rose 1.6% y/y (1.2% expected, 0.8% prior) or 0.7% m/m (0.4% expected and prior), core PI rose 0.6% m/m (0.4% expected, 0.75 prior).
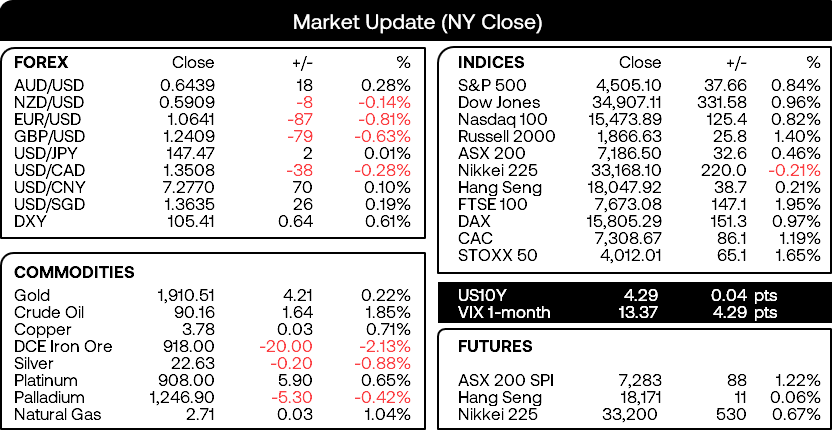
- The US dollar was the strongest forex major and Wall Street indices rose in tandem, with the Dow Jones leading gains with a near 1% rally, whilst the Nasdaq 100 and S&P 500 rose ~0.8%
- EUR/USD was the weakest forex major, falling -0.8% during its worst day in seven weeks and closing beneath 1.0700 to a 4-month low
- GBP/USD was the second weakest forex major and fell to a 3-month low, on growing expectations that the BOE have less of a need to remain hawkish following negative job growth and weaker mortgage data
- WTI crude oil rose to a YTD high on expectations of tighter supply, surpassing our $90 target and now trades less to 4% from the October high
Events in focus (AEDT):
- 11:30 – China’s house prices
- 12:00 – China’s fixed asset investment, industrial production, retail sales, unemployment, NBS press conference
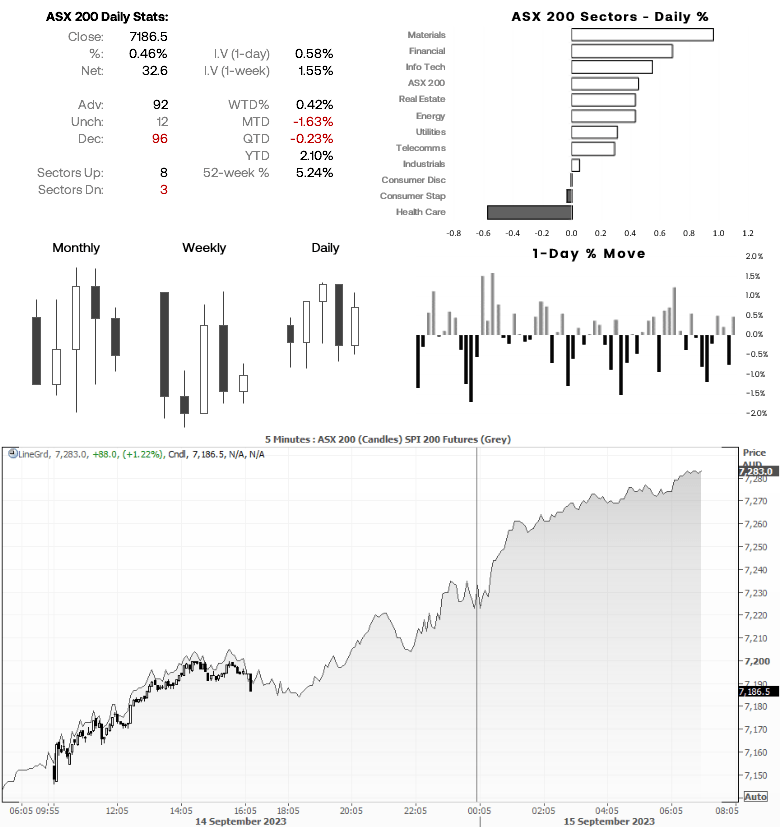
ASX 200 at a glance:
- The ASX 200 cash index produced a bullish inside day on Thursday, although prices were caught between the March 2020 trendline and beneath the 200-day EMA
- Yet the strong lead from Wall street and 1.2% rally on SPI futures point to a very strong open on the ASX 200 cash index today (and comfortably above 7200)
- The area around 7260 makes a likely resistance zone today, but if APAC stocks extend sentiment from Wall Street then perhaps we’re in for a bullish end to the week.
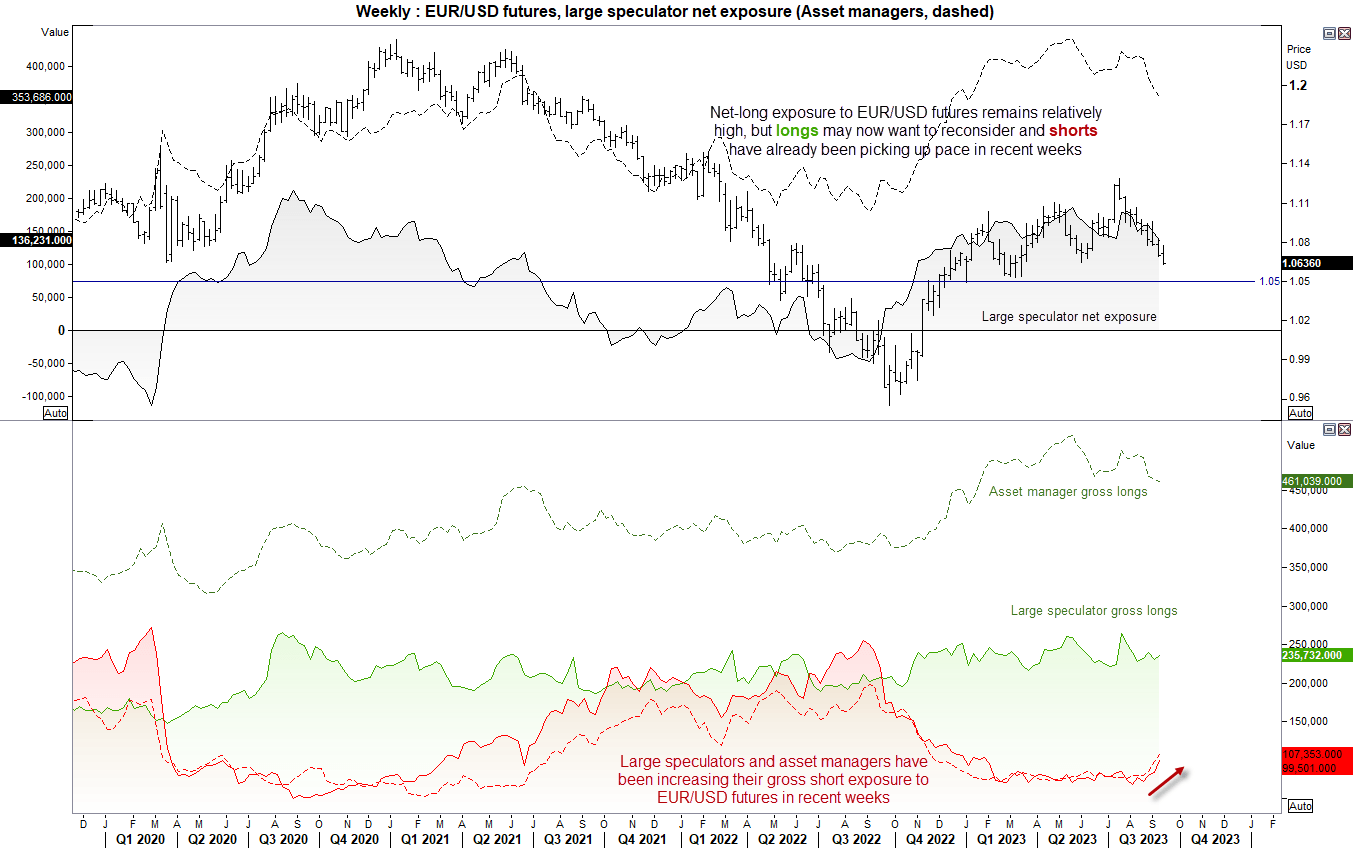
EUR/USD technical analysis (weekly chart):
We noted a few months back that net-long exposure to EUR/USD futures remained relatively high. And whilst it has come off in recent weeks, I suspect many longs will now be questioning their exposure, given the ECB announced an end of-cycle hike and the Fed are to keep their (relatively higher) rates, higher for longer. We can see that large speculators and asset managers have been gently increasing their net-short exposure in recent weeks, so we might now see this accelerate whilst gross longs are close, resulting in lower net-long exposure. 105 seems within relatively easy reach over the near-term, and dare we say lower as the weeks progress. Of course, for now we’ll have to assume the May low (1.0635) and March low (1.0516) are likely interim support levels for bulls to try and defend. But unless we see a trigger to sell USD, then the downside now appears to be the path of least resistance.
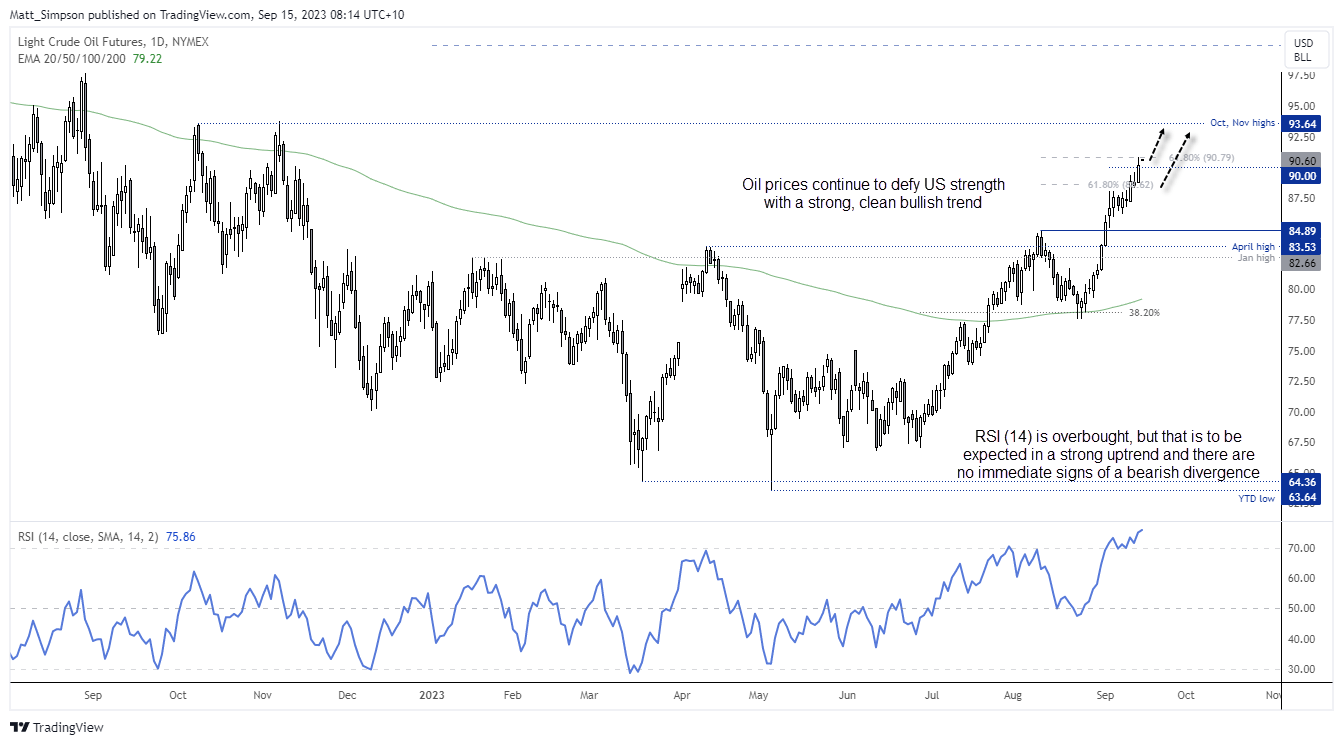
WTI crude oil technical analysis (daily chart):
Oil prices are on fire. Not in the literal sense of course, but WTI’s bullish rally is defying USD strength to the point I wonder where it would be if the US dollar was falling. WTI closed just above $90 on Thursday and have gapped higher early on Friday in Asia. RSI (14) may be ‘overbought’, but that doesn’t mean much in an uptrend as there really is nowhere else for the indicator to go (and OB/OS levels are much more reliable during oscillating markets, and less so during trending markets). And until we see signs of a bearish divergence on the RSI alongside a break of a swing low on the price chart, I’ll have to assume the bull trend remains intact. Therefore, traders could seek bullish continuation patterns on lower timeframes towards the October high, or seek bullish setups following retracements.
View the full economic calendar
-- Written by Matt Simpson
Follow Matt on Twitter @cLeverEdge
How to trade with City Index
You can trade with City Index by following these four easy steps:
-
Open an account, or log in if you’re already a customer
• Open an account in the UK
• Open an account in Australia
• Open an account in Singapore
- Search for the market you want to trade in our award-winning platform
- Choose your position and size, and your stop and limit levels
- Place the trade
Latest market news
Yesterday 01:32 PM
Yesterday 09:35 AM
Yesterday 07:23 AM
Yesterday 04:48 AM
Yesterday 12:17 AM
July 25, 2024 10:39 PM
Latest Asian Open articles

July 25, 2024 10:39 PM

July 24, 2024 10:10 PM

July 23, 2024 11:29 PM

July 22, 2024 10:43 PM