


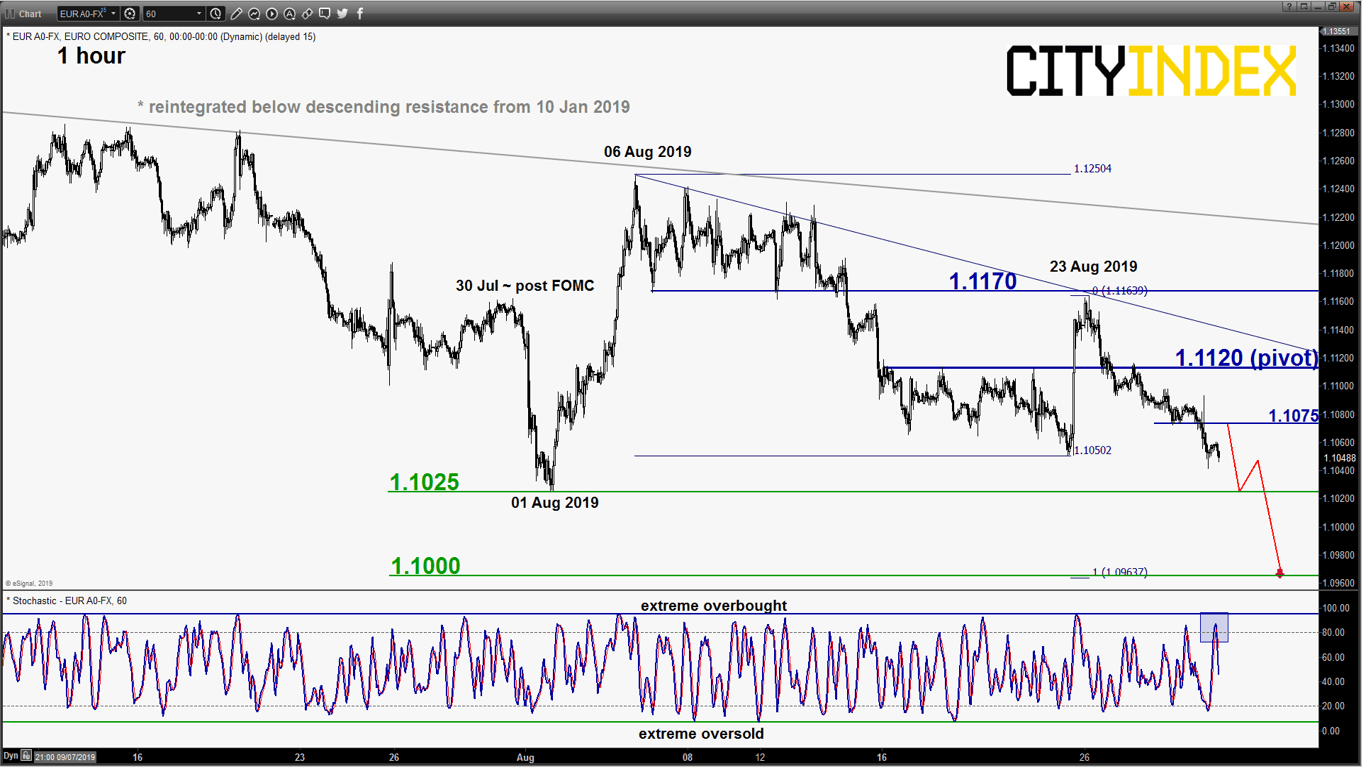
EUR/USD – Further potential downside
click to enlarge chart
- The pair has staged the expected push down as per highlighted in our previous report (click here to recap) and hit the upper limit of the short-term target/support zone of 1.1050/1025 (printed a low of 1.1041 post ECB official Knot’s comment that downplayed further easing policies).
- Maintain bearish bias with a tightened key short-term pivotal resistance at 1.1120 (61.8% retracement of the recent slide from 23 Aug high to yesterday, 29 Aug low & close to the minor descending trendline from 06 Aug 2019 high) for a further potential slide to target 1.1025 (01 Aug & year to date low) and 1.1000 next.
- On the other hand, a break with an hourly close above 1.1120 negates the bearish tone for a squeeze up to retest 1.1170 again.
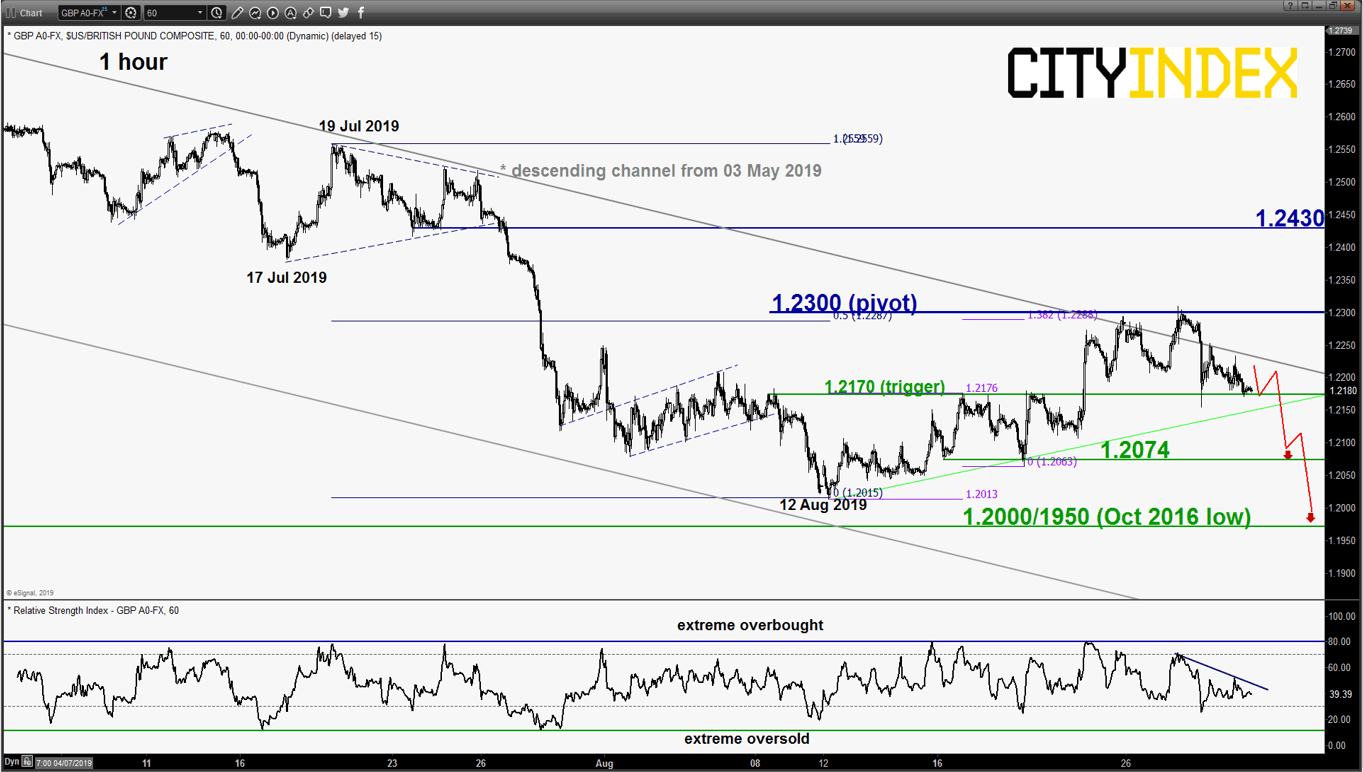
GBP/USD – Testing 1.2170 downside trigger level
click to enlarge chart
- The pair has staged the expected retreat from the 1.2300 short-term pivotal resistance and tested the 1.2170 downside trigger level as per highlighted in our previous report. The slide has been reinforced by the proposed suspension of the U.K parliament that increases the odds of a no-deal Brexit on 31 Oct.
- Key elements remain unchanged; maintain bearish bias below 1.2300 key short-term pivotal resistance and an hourly close below 1.2170 reinforces a further potential downleg to target 1.2074 and 1.2000/1950 next. On the other hand, a clearance with an hourly close above 1.2300 invalidates the bearish scenario for an extended corrective rebound towards the next intermediate resistance at 1.2430.
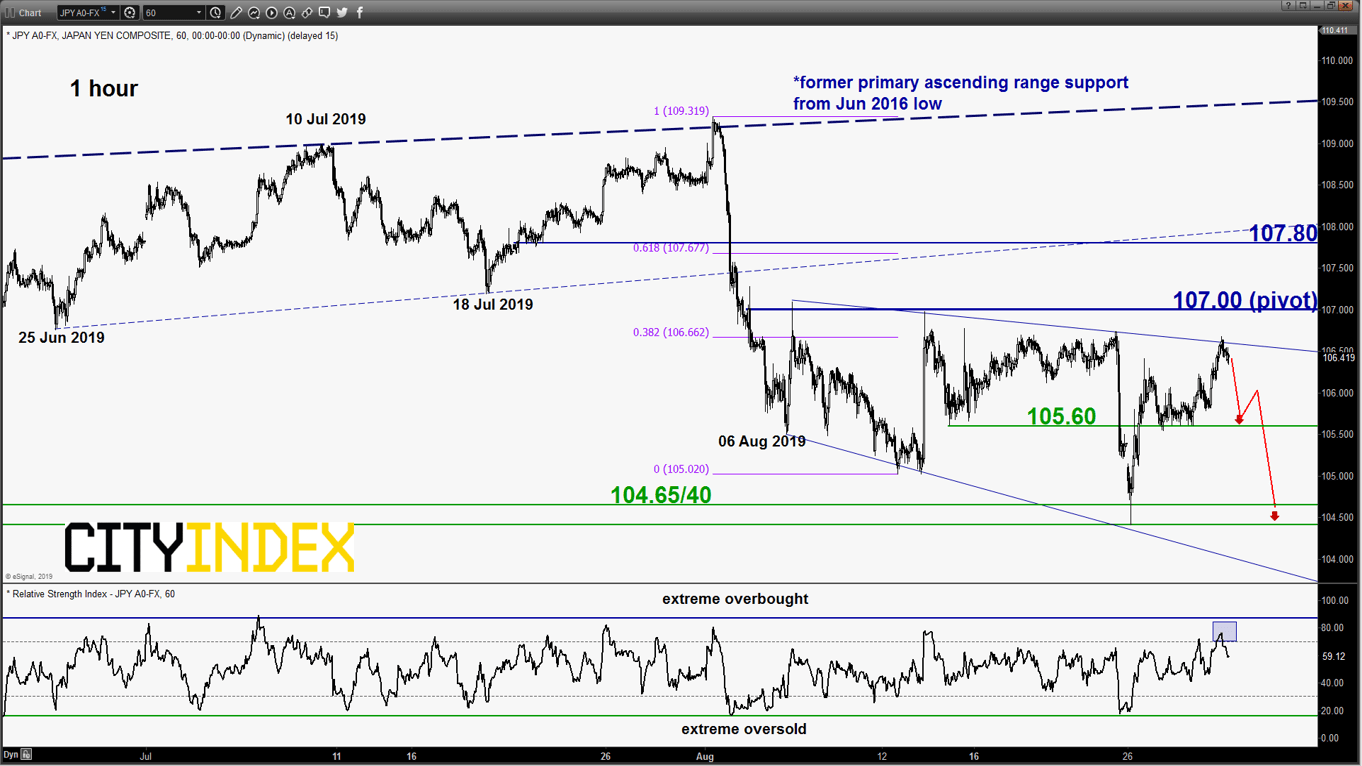
USD/JPY – 107.00 remains the key short-term resistance to watch
click to enlarge chart
- The pair has retested and retreated from the upper limit of the minor complex range configuration in place since 06 Aug 2019 with the 1-hour RSI oscillator that has exited from the overbought region.
- Maintain bearish bias below 107.00 key short-term pivotal resistance for a potential push down towards 105.60 near-term support and a break below it may see a further slide towards 104.65/40. On the other hand, a clearance with an hourly close above 107.00 sees an extended corrective rebound towards 107.80 (former ascending range support from 25 Jun 2019 low).
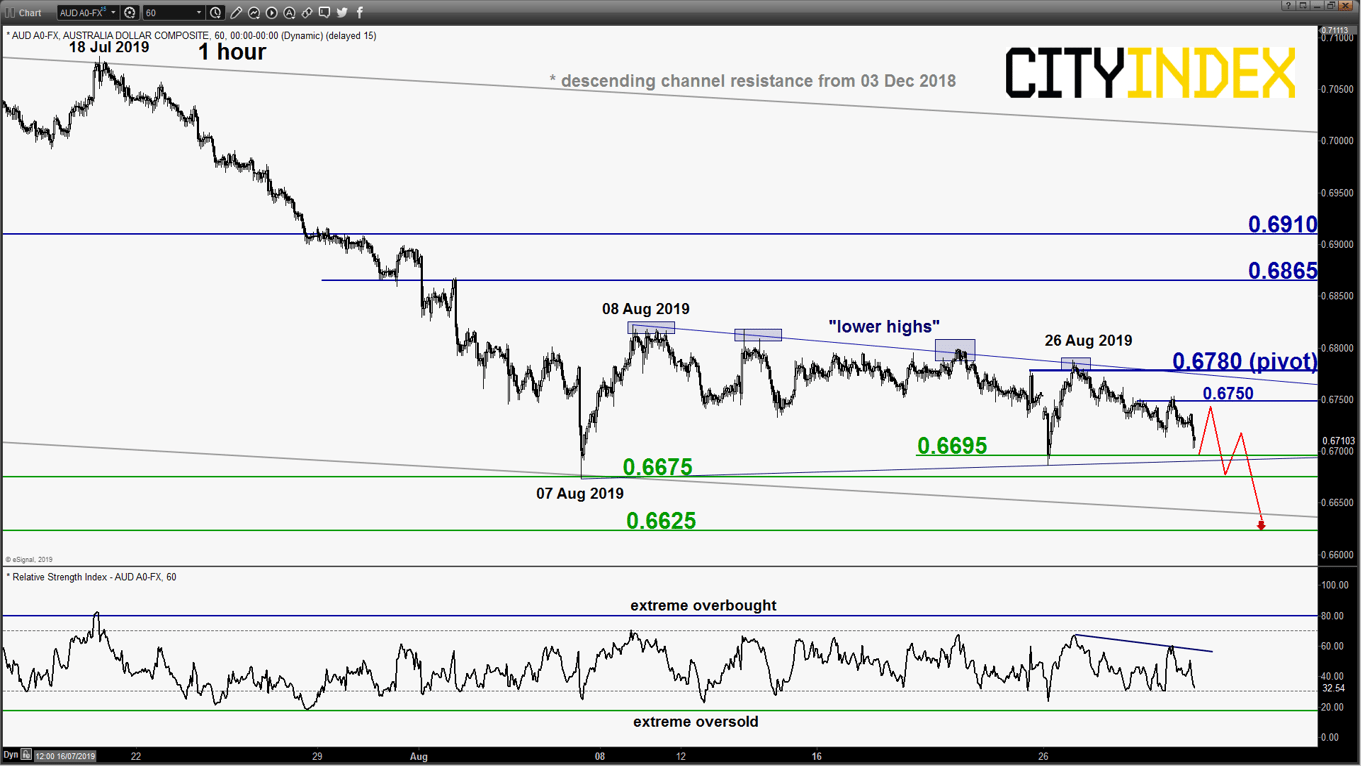
AUD/USD – Looking vulnerable for range bearish breakdown
click to enlarge chart
- The pair has staged the expected retreat from the upper limit of a minor “symmetrical triangle” range configuration in place since 07 Aug 2019 low. Maintain bearish bias in any bounces below 0.6780 key short-term pivotal resistance for a potential bearish breakdown below 0.6995/6675 (range lower limit) to target the next support at 0.6625 (Fibonacci expansion cluster & lower boundary of the primary descending channel from 03 Dec 2018 high).
- On the other hand, a break with an hourly close above 0.6780 sees an extension of the corrective rebound towards the next resistance at 0.6865 (also close to the 50% Fibonacci retracement of the recent steep decline from 18 Jul high to 07 Aug 2019 low).
Charts are from eSignal
Latest market news
Yesterday 03:00 PM
Yesterday 01:12 PM
Yesterday 11:14 AM
Latest EUR articles
April 13, 2024 08:00 PM
March 25, 2024 02:55 AM
January 22, 2024 04:19 AM
January 18, 2024 04:46 AM