

Market summary
- The RBA delivered another 25bp hike (their 12th this cycle) to take their cash rate to 4.1%
- Whilst the RBA suspect that ‘inflation has passed its peak’ it remains ‘too high’ and some further tightening may be required
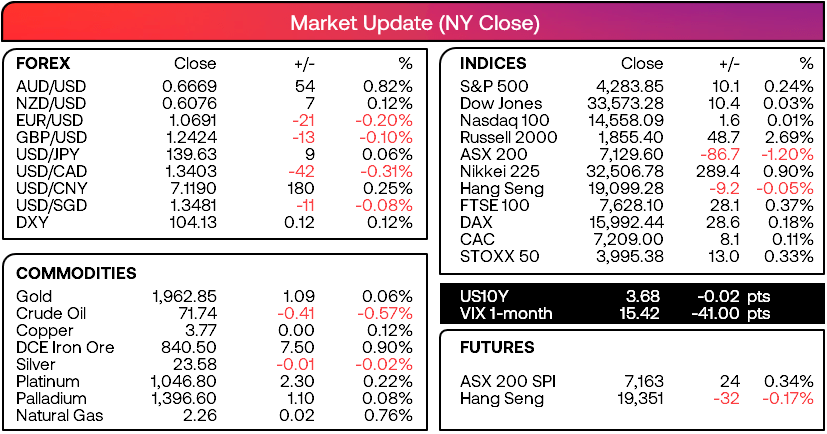
- AUD pairs were broadly higher, the Aussie was the strongest FX major, AUD/JPY closed to a fresh YTD high and the ASX 200 erased all of Mondays gains
- The Canadian dollar was given a lift following the RBA’s hike, as it slightly increases the odds of a BOC hike tonight or hawkish tone (they have paused the last two meetings and we suspect they will hold again today)
- Oil prices have done full circle, having filled Monday’s gap higher, pulled back towards $70 yesterday’s before rising back to Friday’s close (making it a directionless, tricky market to trade for now)
- Wall Street was slightly higher but volatility was low for the S&P 500, Nasdaq and Dow Jones
- Apple shares were a touch lower following Monday’s key reversal
- The world bank increased global growth forecasts for 2023 but downgraded them fore 2024
Events in focus (AEDT):
- 09:20 – Speech by Philip Lowe, Governor – A Narrow Path
- 09:50 - Panel Participation by Michele Bullock, Deputy Governor
- 11:30 – Australian GDP report
- 13:00 – China trade data
- 00:00 - BOC cash rate decision (hold expected)
ASX 200 at a glance:
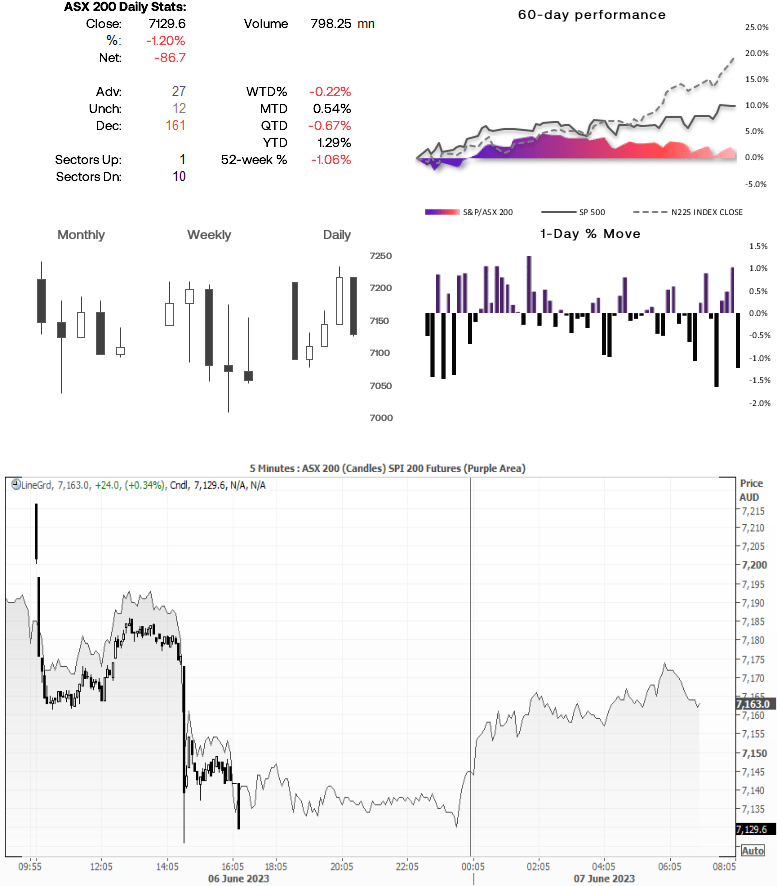
- A bearish engulfing day formed due to the RBA hike
- 10 of its 11 sectors closed lower, led by consumer discretionary and industrial
- Intraday support: 7127, 7110.8, 7100 and 7077
- Intraday resistance: 7161.5, 7185.8
AUD/USD 1-hour chart:
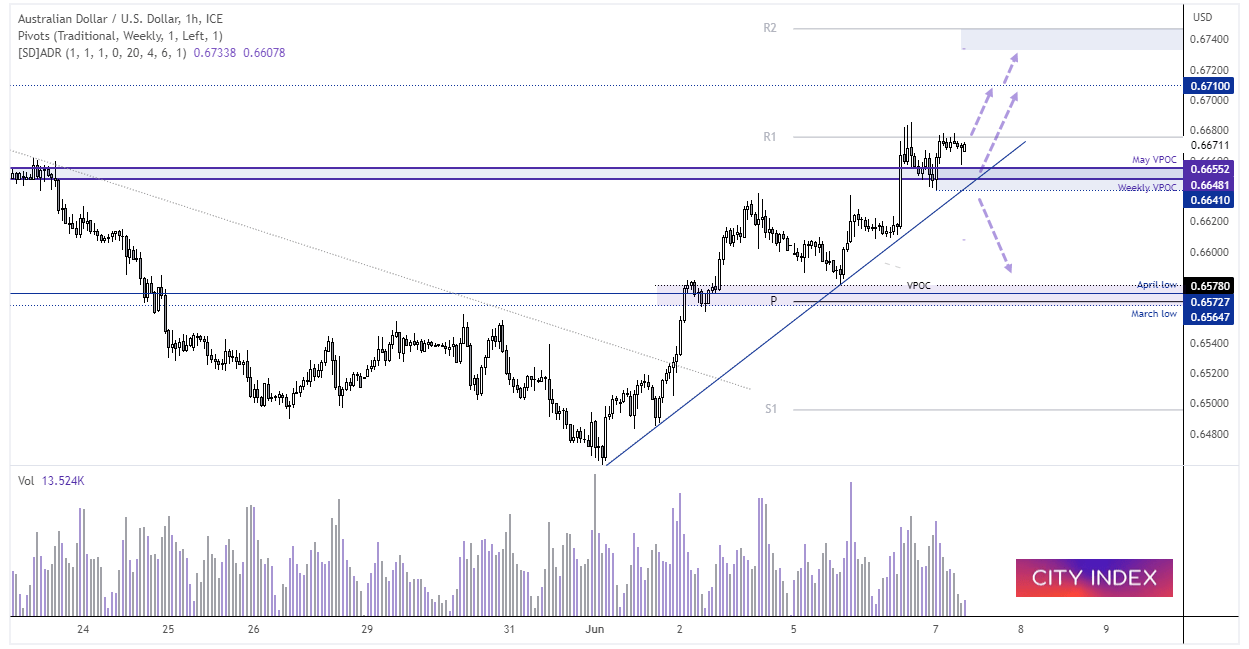
AUD/USD posted a strong rally immediately following the RBA’s hike, prices have since pulled back into the VPOC support zone and are now trying to break to a new cycle high. A bullish pinbar formed at the end of the NY close so perhaps it can break above the weekly R1 pivot and continue higher towards 0.6700 / 1.67100, and the upper ADR band near the weekly R2 pivot. A break beneath the bullish trendline assumes a retracement against the June rally is underway.
-- Written by Matt Simpson
Follow Matt on Twitter @cLeverEdge
How to trade with City Index
You can trade with City Index by following these four easy steps:
-
Open an account, or log in if you’re already a customer
• Open an account in the UK
• Open an account in Australia
• Open an account in Singapore
- Search for the market you want to trade in our award-winning platform
- Choose your position and size, and your stop and limit levels
- Place the trade
Latest market news
Yesterday 01:32 PM
Yesterday 09:35 AM
Yesterday 07:23 AM
Yesterday 04:48 AM
Yesterday 12:17 AM
July 25, 2024 10:39 PM
Latest AUD/USD articles

Yesterday 12:17 AM

July 24, 2024 10:10 PM

July 24, 2024 12:14 AM

July 22, 2024 10:43 PM