

Asian Futures:
- Australia's ASX 200 futures are down -1 points (-0.01%), the cash market is currently estimated to open at 7,393.40
- Japan's Nikkei 225 futures are up 350 points (1.27%), the cash market is currently estimated to open at 27,898.00
- Hong Kong's Hang Seng futures are down -212 points (-0.78%), the cash market is currently estimated to open at 27,109.98
UK and Europe:
- UK's FTSE 100 index rose 59.28 points (0.85%) to close at 7,027.58
- Europe's Euro STOXX 50 index rose 50.05 points (1.23%) to close at 4,109.10
- Germany's DAX index rose 154.75 points (1%) to close at 15,669.29
- France's CAC 40 index rose 87.23 points (1.35%) to close at 6,568.82
Friday US Close:
- The Dow Jones Industrial rose 238.15 points (0.68%) to close at 35,061.55
- The S&P 500 index rose 44.31 points (1.02%) to close at 4,411.79
- The Nasdaq 100 index rose 171.626 points (1.15%) to close at 15,111.79
Learn how to trade indices
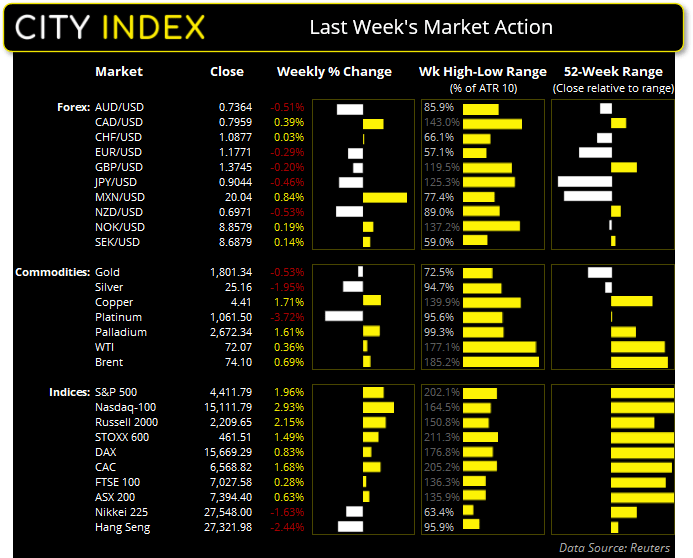
Global indices close with bullish outside weeks
Equity markets produced quite the turnaround last week after a particularly bearish Monday. Whilst the rise of the Delta variant weighed on sentiment and drove indices lower on Monday, strong earnings from the US bolstered sentiment and which produced strong weekly bullish engulfing candles on US and European indices. The STOXX 600, S&P 500 and Nasdaq 100 closed to record highs and the FTSE 100 recovered from its 200-week eMA and printed an elongated bullish pinbar. Interestingly the Hang Seng Index held above its 200-week eMA yet remains trapped beneath its 200d-day eMA.
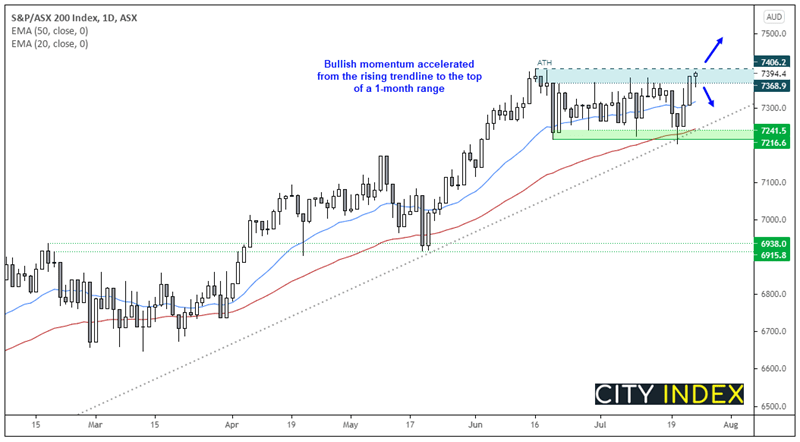
The ASX 200 closed to a record high (on a closing basis, or line chart) yet remains just below the June high of 7406.20. Is also produced a bullish outside week from trend support, which doubles as a potential bullish hammer which would be confirmed with a break above 7406.20.
However, the daily chart shows a hanging man candle at the top of its range so a near-term reversal would be confirmed with a break of Friday’s low. But due to the bullishness seen between Wednesday ad Thursday, the bias remains for an eventual break to new highs even if prices dip lower initially. Therefore, a break above 7406.20 assumes bullish continuation.
ASX 200 Market Internals:
ASX 200: 0 (0.00%), 25 July 2021
- 70% of stocks closed above their 200-day average
- 59.5% of stocks closed above their 50-day average
- 55% of stocks closed above their 20-day average
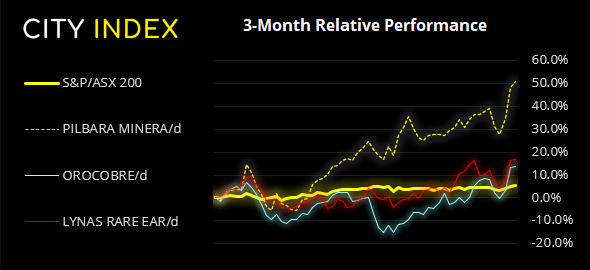
Outperformers:
- + 10.1% - Pilbara Minerals Ltd (PLS.AX)
- + 9.91% - Orocobre Ltd (ORE.AX)
- + 9.01% - Lynas Rare Earths Ltd (LYC.AX)
Underperformers:
- -7.78% - Zip Co Ltd (Z1P.AX)
- -3.11% - Kogan.com Ltd (KGN.AX)
- -1.69% - Omni Bridgeway Ltd (OBL.AX)
Safe havens remain strongest currencies in July:
Safe-havens CHF and JPY remain the strongest currencies in July as we head into the last week of trade this month, whilst AUD and CAD are the weakest.
And to underscore AUD weakness, a bearish outside week formed on AUD/CAD and closed on the October 2020 low. Prices are consolidating on the daily chart but we are now anticipating a bearish breakout in line with its daily trend.
AUD/JPY has retraced to its 200-day eMA from below, with the monthly S1 sitting around the 82 handle and February low, so we’re on guard for a swing high to form.
The US dollar index (DXY) remains within a bullish channel on the daily chart and closed above its 10-day eMA on Friday. Our bias remains bullish above 92.50 although the lower trendline can also be used as an invalidation point.
Learn how to trade forex
From the Weekly COT Report (Commitment of Traders)
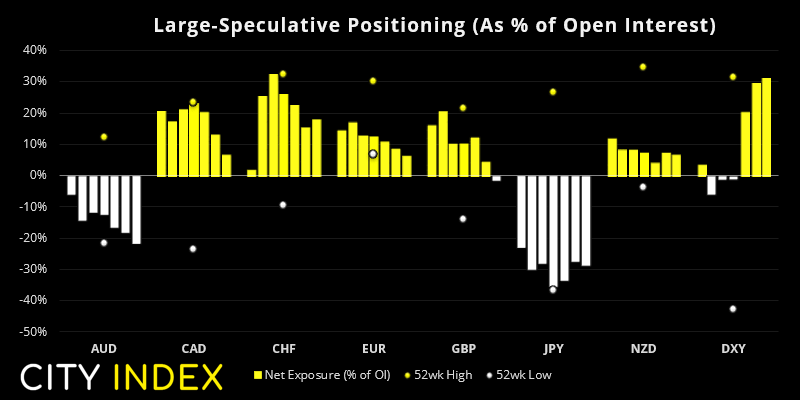
From Tuesday 20th July 2021:
- According to data compiled by IMM, traders flipped to net-long exposure on the US dollar for the first time since March 2020. They are net-long by US $222 million ($189 million against G10 currencies and $33 million against emerging markets).
- Large speculators increased their net-long exposure for a third consecutive week, and to its most bullish level in 14-months.
- Traders flipped to net-short exposure on British pound futures for the first time this year, in response to ‘freedom-day’ going ahead.
- Traders were their most bearish on the Australian dollar sin 13-months and gross shorts rise to their highest level since March 2020.
- Traders reduced their net-long exposure to Canadian dollar futures by -13.5k contracts (-12.6%). Gross longs have been trending lower since the June peak and gross shorts have risen the past 3-weeks.
Copper perks up:
Copper futures are on the verge of breaking out. After two bullish closed above trend resistance the 4.435 resistance level has been tested and early Asian trade has seen prices open just above it.
Gold tested 1790 support on Friday and produced a (potentially) bullish hammer on the daily chart, yet a cluster of eMA’s are capping as resistance (10, 20, 50 and 200-day eMA’s sit between 1808 – 1812). So whilst we remain slightly optimistic a low has been seen, it remains a tricky market to trade on the daily timeframe.
Silver posted a bearish outside day at its 200-day eMA to suggest a swing-high is in place. A break beneath 24.75 assumed bearish continuation. A stronger US dollar would help with this.
WTI has opened to a seven-day high but each day since last week’s low has been seen on lower volumes, which suggests the bounce may be corrective. However, should prices remain elevated and then we see volumes increase then we could then assume the low is in place at 65.0.
Up Next (Times in AEST)
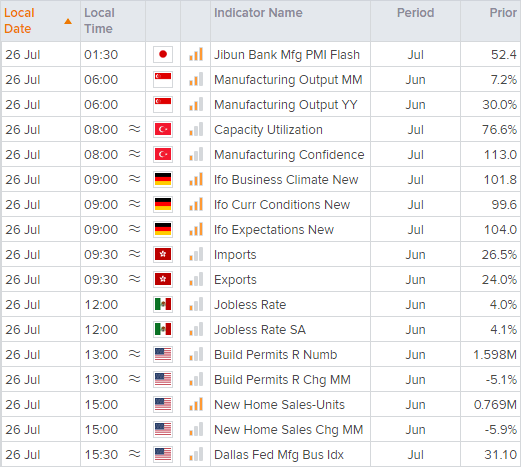
You can view all the scheduled events for today using our economic calendar, and keep up to date with the latest market news and analysis here.
How to trade with City Index
Follow these easy steps to start trading with City Index today:
- Open a City Index account, or log-in if you’re already a customer.
- Search for the market you want to trade in our award-winning platform.
- Choose your position and size, and your stop and limit levels.
- Place the trade.
10.1.1
Latest market news
Yesterday 01:32 PM
Yesterday 09:35 AM
Yesterday 07:23 AM
Yesterday 04:48 AM
Yesterday 12:17 AM
July 25, 2024 10:39 PM
Latest Indices articles

July 25, 2024 01:30 PM

July 25, 2024 01:01 AM

July 25, 2024 12:41 AM

July 24, 2024 07:26 PM