


The Fed delivered their hawkish hold, and that means the Fed’s policy has effectively widened relative to the BOJ’s once more which refreshes the upside bias for USD/JPY. In fact, the US-JP 2-year yield has hit fresh cycle highs ahead of tomorrow’s BOJ meeting. And whilst the risk of verbal intervention remains from the MOF/BOJ, they may not actually intervene if the trend remains orderly. And price action on the daily chart suggests that it is.
It seems unlikely the BOJ will announce any change of policy tomorrow, or soon for that matter. Although you never know for sure with this central bank. The BOJ widened their YCC band recently, and whilst Ueda prompted some excitement that the BOJ may hike rates before abandoning YCC control, he dismissed the possibility of it being this year. Economists currently favour the BOJ’s first hike in H2 2024. And with a current interest rate of -0.1bp, it is hard to imagine a meaty 25 or 50bp hike anyway. And that further builds the case for a higher USD/JPY.

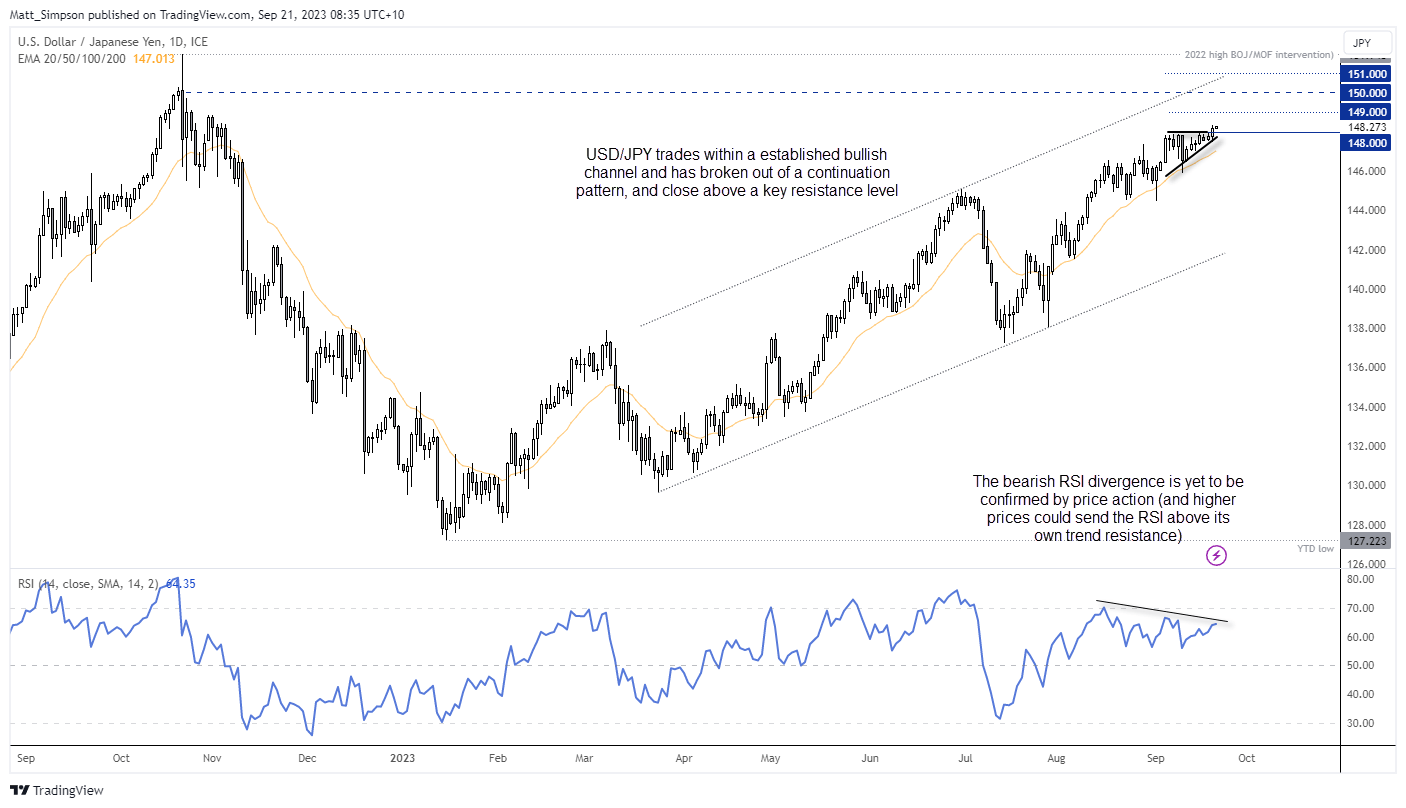
USD/JPY technical analysis (daily chart):
USD/JPY has spent much of this year in a well defined bull trend on the daily chart, and trades within an established bull channel. Whilst a bearish divergence is forming on the RSI (14), price action is yet to confirm the divergence with a break of a swing low on the daily chart. Besides, if prices are to break decisively higher, it would cause the RSI to break its own trendline (as indicators follow price).
We can see a clean close above the 148 handle, a level the market was hesitant to break ahead of the FOMC meeting. Yet the series of higher lows heading into 148 resistance makes the trend structure appear the more bullish to my eyes. And should prices retrace, the 20-day EMA has done a decent job of supporting prices over the past couple of months.
With a breakout from a bullish continuation pattern now chalked up and the wider divergence between the Fed and BOJ’s policies, the 149 and 150 handles are now in focus for bulls.
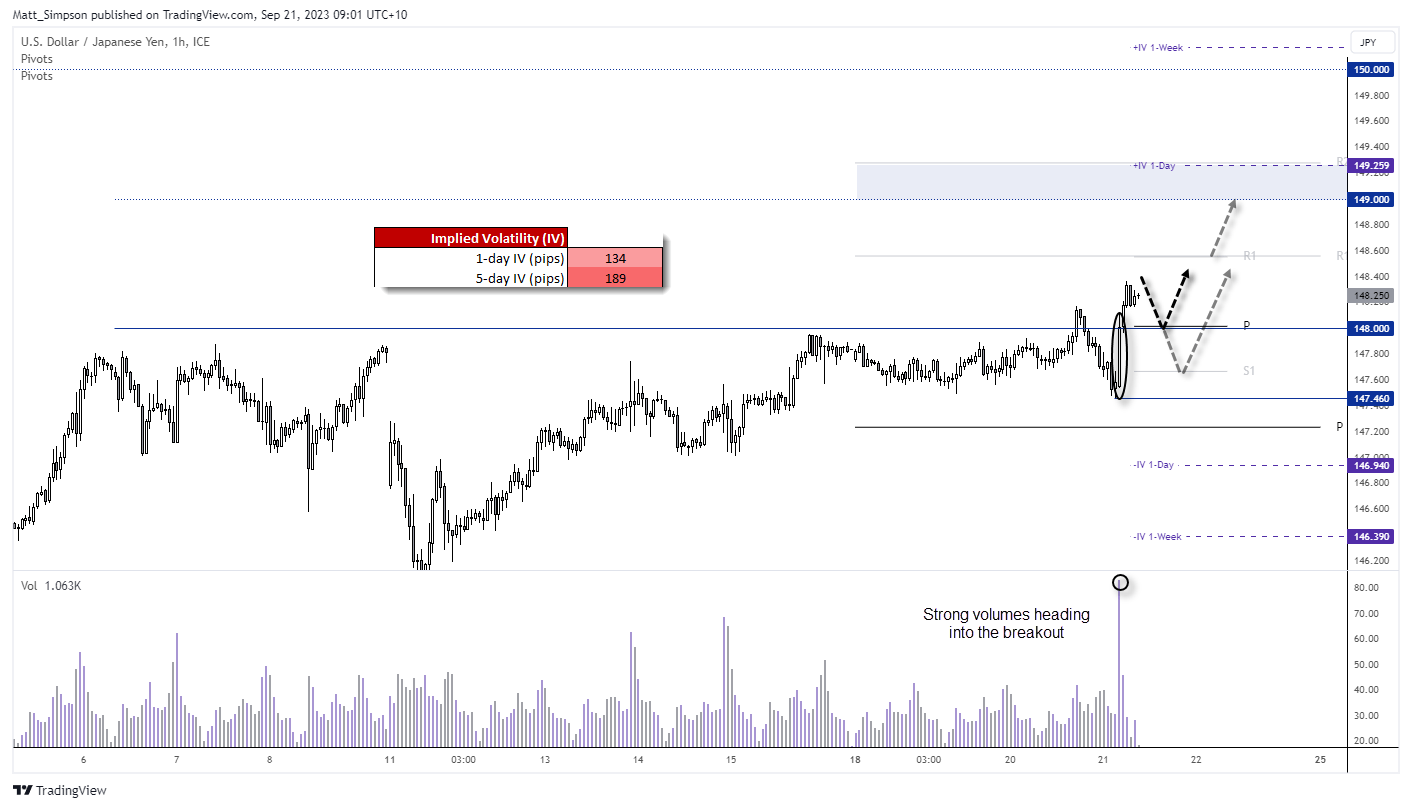
USD/JPY technical analysis (1-hour chart):
The 1-hour chart shows that prices produced a false breakout above 148 ahead of the FOMC meeting, yet then formed a prominent swing low at 147.46 before strong volumes lead the true breakout above key resistance. The bias remains bullish above the 147.46 low and we’d prefer to seek dips above support levels such as the daily pivot ~148 or the daily S1 ~147.70. Note that the daily and weekly R1 coincide at 148.55, making it a likely interim resistance level. but with a 1-day implied volatility level of 134 pips and 189 over the next week, we may well see USD/JPY break above 149 if the BOJ stand pat as expected.
-- Written by Matt Simpson
Follow Matt on Twitter @cLeverEdge
How to trade with City Index
You can trade with City Index by following these four easy steps:
-
Open an account, or log in if you’re already a customer
• Open an account in the UK
• Open an account in Australia
• Open an account in Singapore
- Search for the market you want to trade in our award-winning platform
- Choose your position and size, and your stop and limit levels
- Place the trade
Latest market news
Today 10:46 AM
Today 05:56 AM
Yesterday 11:57 PM
Yesterday 08:00 PM
Latest Trade Ideas articles

Today 05:56 AM

Yesterday 11:57 PM
April 26, 2024 11:40 AM

April 25, 2024 03:00 PM