


- S&P 500 analysis: key levels to watch
- FOMC minutes, CPI and Consumer Sentiment among key data highlights
- US Bank earnings to start Friday
- Dollar Index shows potential reversal signal
Welcome to another edition of Technical Tuesday. In this week’s report, we will get technical on the S&P 500 and Dollar Index.
S&P 500 analysis: technical levels to watch
Before briefly discussing the macro factors, let’s talk technical first. After falling for two consecutive months, the S&P has made a bright start to the new month and quarter. The US benchmark stock index is now up for two consecutive weeks, making back around a third of those losses. Whether this is the start of a more meaningful recovery or not will depend on several macro factors obviously like the direction of bond yields, risk appetite and upcoming company earnings. But from a shorter-term technical perspective, we will get a clearer picture about the direction of the near-term trend depending on where the index will finish today’s session.
That’s because, the S&P has now arrived at a key technical juncture around 4335 to 4356, where it had previously found support from before breaking down. We also have the 21-day exponential moving average come into play here, making it a technically-important zone:
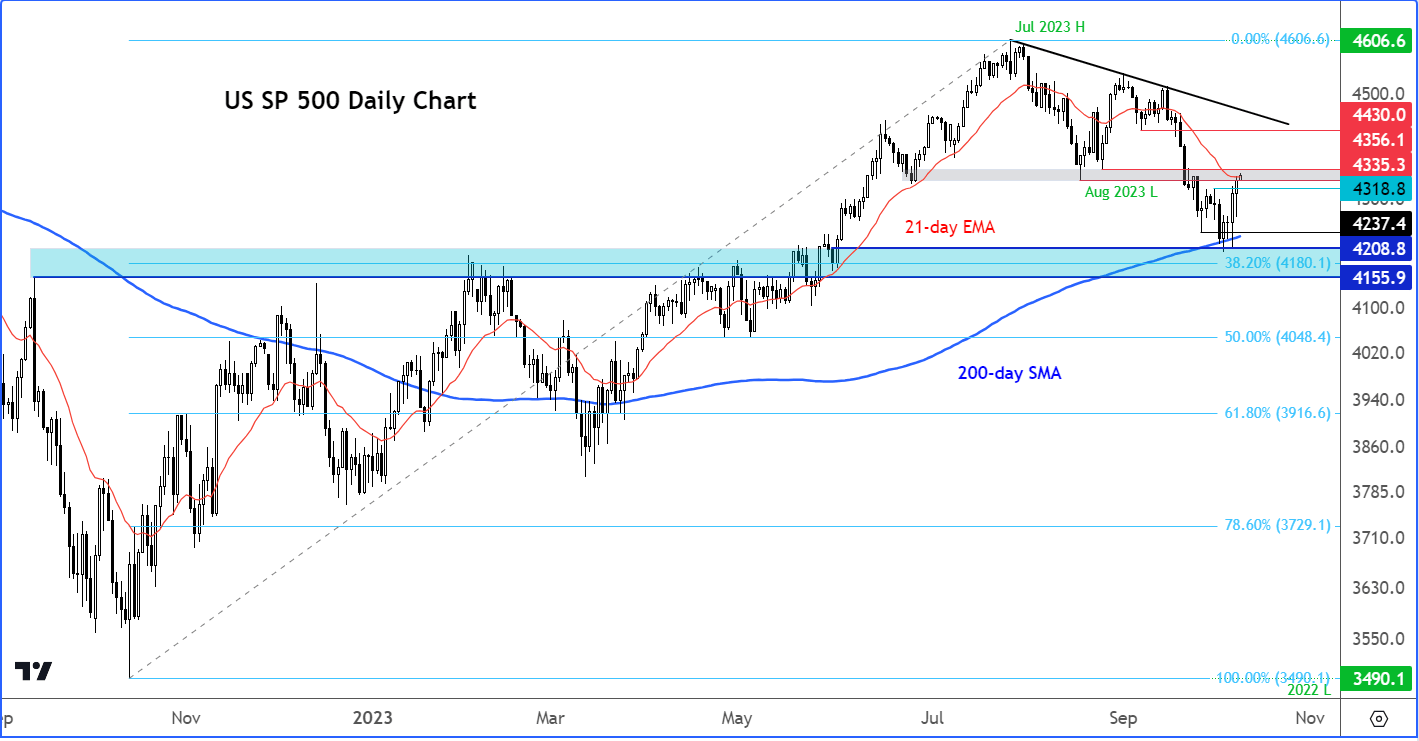
Given that the long-term bullish technical picture has remained unscathed following the heightened volatility in September, the bears must now await a fresh signal before they look for bearish trades again. An inverted hammer, engulfing or another bearish pattern is what many conservative bears would be eyeing, before potentially stepping in on the short side again.
The bulls would be pleased to see the S&P hold its own rather well following the recent volatility, finding good support at the top of the long-term support range between 4156 to 4209 (shaded blue area on the chart), and refusing to break the 200-day average meaningfully. The index has now reached its first objective from that support area, around 4335 to 4356. So, even if it were to go lower again, the bulls have had some success. The index now needs to break decisively above this 4335 to 4356 area to pave the way for follow-up technical buying towards the next resistance around 4430.
FOMC minutes, CPI, Consumer Sentiment Survey and JPMorgan all on tap this week
Following the unfortunate events at the weekend that caused gaps in most risk assets, the focus will slowly turn back to macro factors later in the week.
First up is the FOMC meetings minutes, due on Wednesday. The Fed’s hawkish pause last month sent the dollar surging higher alongside bond yields. At that meeting, the FOMC trimmed their interest rate cut projections in 2024 from 4 to just 2 and left open the possibility of one more rate increase before the end of 2023. As a result, the market was forced to revise higher its prior dovish expectations. The minutes of that meeting will reveal more insights into the Fed’s thinking and thereby help to fine-tune market’s expectations. But how much of that is now priced in?
Then, on Thursday, it will all about US CPI. The market appears convinced that the Fed’s tightening cycle is over, but equally they are not expecting any rate cuts any time soon. This is because macro indicators in the US have remained relatively upbeat compared to the rest of the world. The dollar bulls will be looking for further evidence in incoming data, such as Thursday’s CPI print, to support the Fed’s view in keep rates high for long. Last month, CPI surprised to the upside, rising to 3.7% from 3.2%, ending a 14-month run of falling price pressures. But if there’s renewed weakness observed in CPI then this could further alleviate pressure on risk assets.
On Friday, we will see the start of the earnings season with JPMorgan, Wells Fargo and Citigroup all posting their results. Bank of America, Goldman Sachs and Morgan Stanley will follow next week. We will also have at least one important macro indictor to look forward to: UoM’s Consumer Sentiment. Since the middle of last year, consumer sentiment has generally been improving despite borrowing costs continuing to rise and price pressures remaining elevated. In more recent weeks, concerns over interest rates remaining high for longer in the US has caused lots of volatility in across financial markets. We have seen a sharp sell-off in stocks while bond yields have hit levels last seen before the global financial crisis. If these concerns filter through to the consumer, then spending is likely to fall on non-essential items, potentially causing the economy to come to a standstill. The UoM survey will give us an advanced indication on this front.
Dollar Index analysis: DXY prints potential bearish signal
The dollar index ended its multi-week run of wins last week when it formed an inverted hammer/doji candle (see inset). There has been some follow-up technical selling at the start of this week.
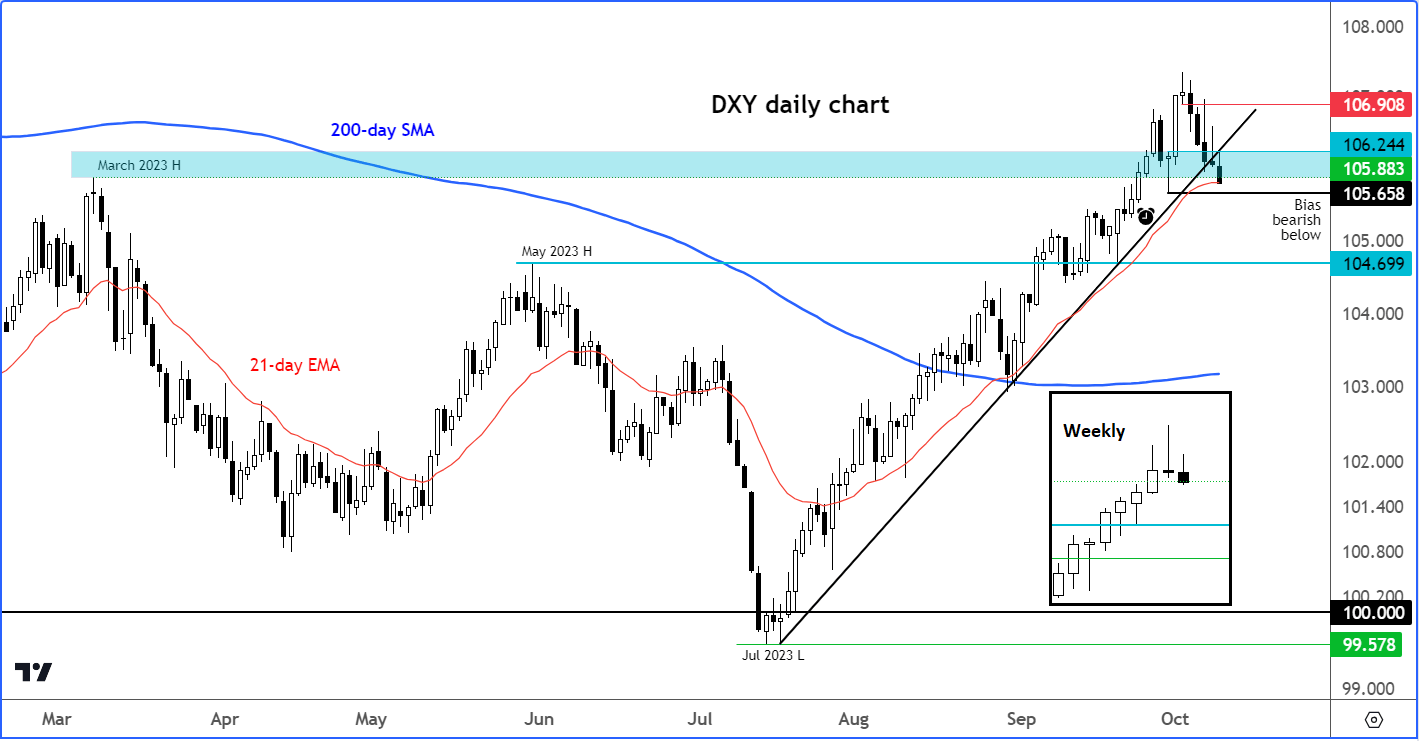
The dollar bears would now like to see the DXY break 105.65, which was the last low made prior to its latest move higher. If this level were to break, we will then have our first lower high in place, and thereby another bearish signal. If seen, that could further encourage the bears to take advantage of the change in the tide, after the mostly one-way trade for the past couple of months. A potential break below 105.65 could pave the way for a drop to 104.70, which was previously resistance back in May, before turning into support in this recent dollar up trend.
Meanwhile, the dollar bulls will be looking for fresh bear trap signals to emerge. For example, a decisive move back above last week’s low at 105.95 could put the bears in a spot of bother.
Video: It is also worth watching USD/JPY among other major FX pairs
Given that the week has just started and we have a few key data releases coming up later in the week, with FOMC minutes on Wednesday, US CPI on Thursday and UoM Consumer Sentiment survey on Friday, a lot could still change. See above for more.
So, remain vigilant and take it from one level to the next until there is more clarity on the direction of the trends.
-- Written by Fawad Razaqzada, Market Analyst
Follow Fawad on Twitter @Trader_F_R
Source for all charts used in this article: TradingView.com
How to trade with City Index
You can trade with City Index by following these four easy steps:
-
Open an account, or log in if you’re already a customer
• Open an account in the UK
• Open an account in Australia
• Open an account in Singapore
- Search for the company you want to trade in our award-winning platform
- Choose your position and size, and your stop and limit levels
- Place the trade
Latest market news
Yesterday 06:37 AM
April 26, 2024 01:25 PM
April 26, 2024 11:40 AM
Latest Technical Tuesday articles

April 23, 2024 04:00 PM

April 9, 2024 11:30 AM

April 2, 2024 04:00 PM

March 26, 2024 12:00 PM