


We are now in the second full trading week of September, a month which has averaged negative returns for the Nasdaq 100. It is also the only month of the year to generate negative average returns over this period. With a key US inflation report scheduled for Wednesday, it has the power to make or break trends if it deviates too far from expectations. And with estimates siding with higher CPI levels on an annual and monthly basis, perhaps traders are in for a downside surprise. This could potentially weigh on the US dollar and support sentiment for risk assets such as the Nasdaq 100. Of course, the opposite is also true. If we see a hot set of numbers catch markets off guard, it could well topple the Nasdaq and help send it lower in line with its seasonal tendency.
With that said, August produced a hanging man candle, which snapped a 5-month winning streak. Perhaps September came early? And while September has been the only month of the year to provide negative returns on average, it has had a positive win rate of 54.1%. This indicates that the severity of the bearish months have outstripped the bullish months.
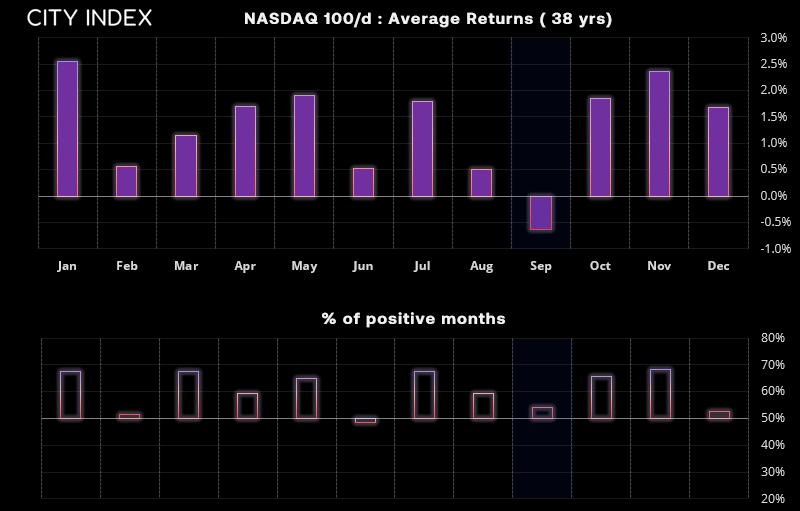
Nasdaq 100 seasonality patterns in September (38 years)
- ·-0.64% average return in September
- 54.1% were bullish months (45.9% were bearish)
- Positive months in September averaged 4.5%
- Negative months in September averaged -6.7%
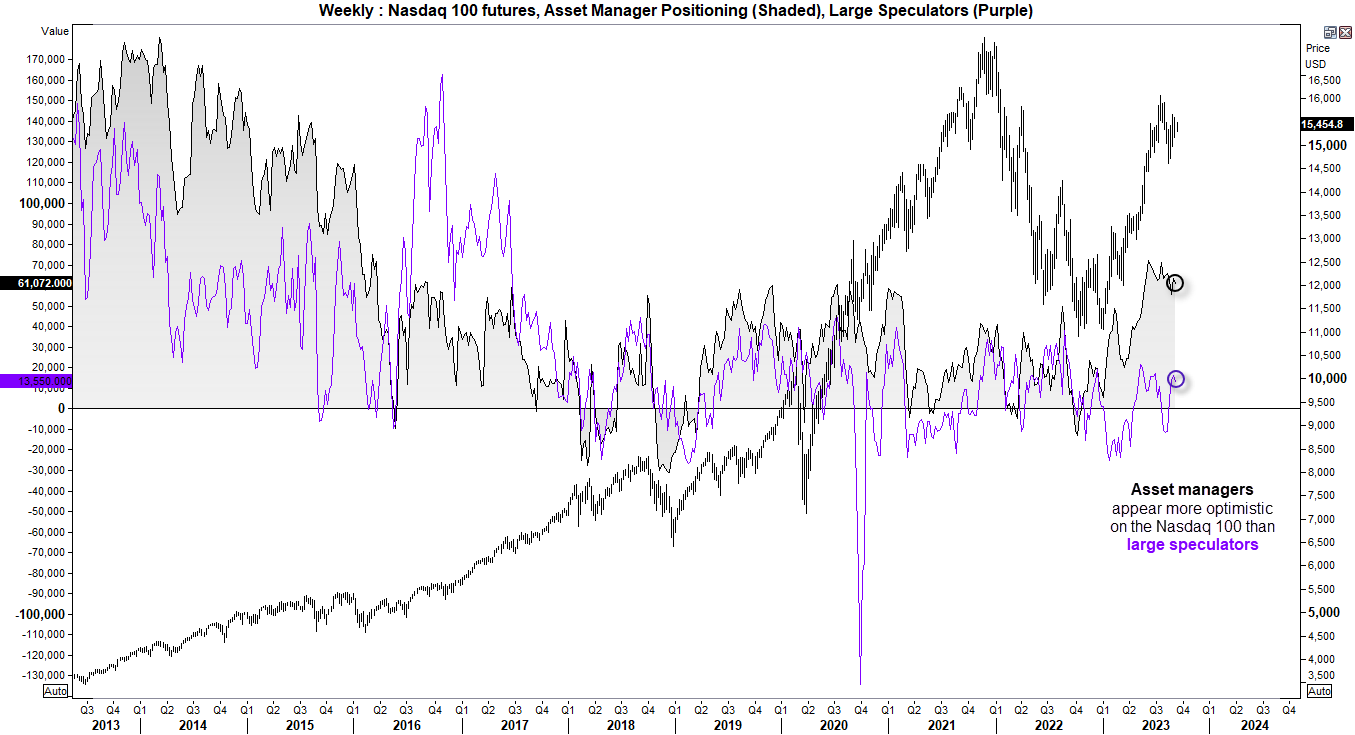
Nasdaq 100 market positioning:
Both asset managers and large speculators remain net-long Nasdaq 100 futures, according to the latest Commitment of Traders Report (COT). However, the two groups of traders are not in complete agreement. Asset managers are net-long relative to the past seven years, but less than half of what was seen at the 2013 and 2014 peaks. Overall, I take this to be a bullish sign. Since net-long exposure among asset managers has retraced with prices, perhaps it is not at a sentiment extreme. Large speculators are far more reactive to near-term swings, and their net-long exposure remains relatively low by historical standards. In the event of a downturn for the stock market in general, we could expect large speculators to revert to net-short exposure to the Nasdaq a lot sooner than asset managers. But overall, both groups of traders remain net long the market.
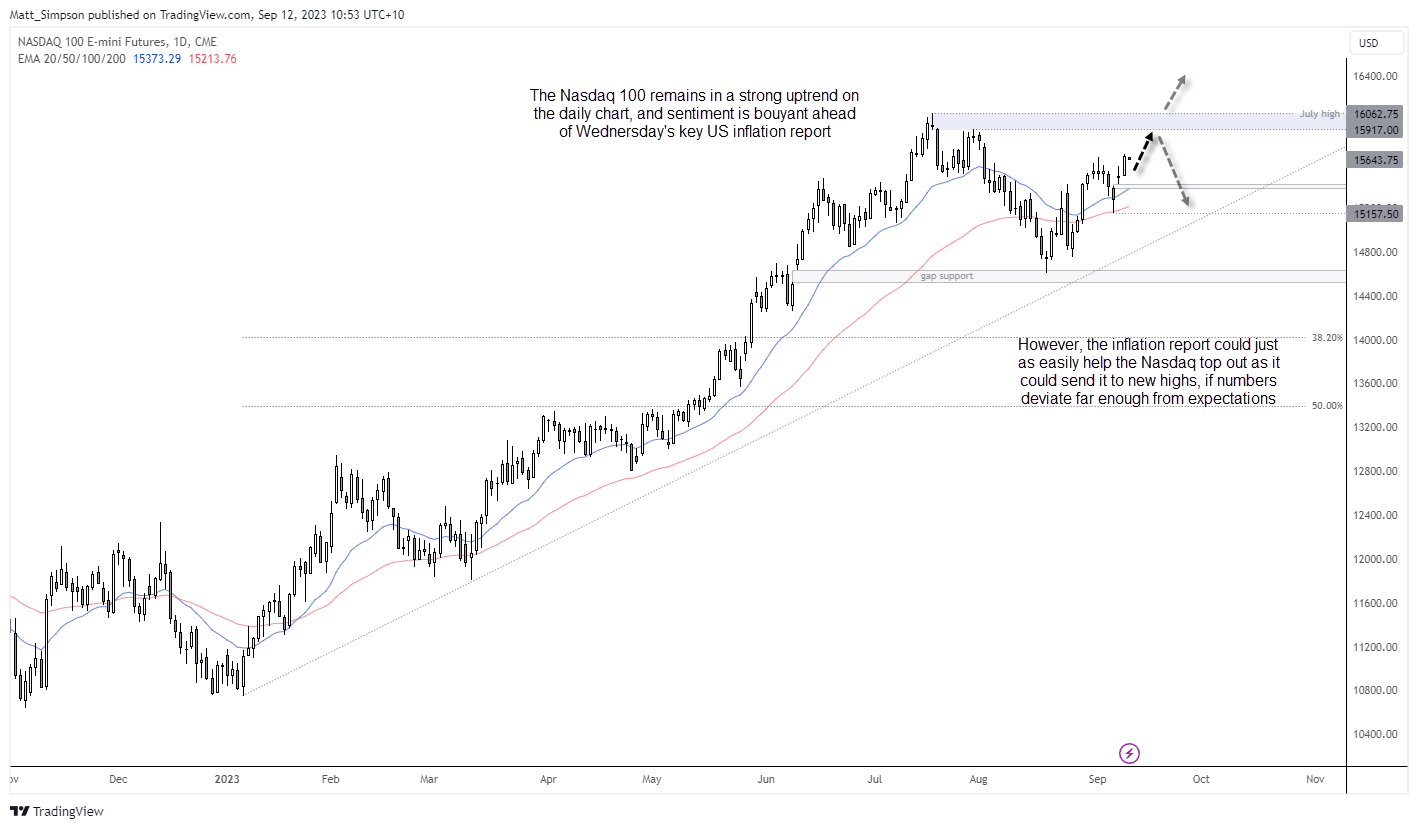
Nasdaq 100 technical analysis (daily chart):
This week could really be a game of two halves, with the US inflation report being the halftime point. If traders are confident that US inflation will continue to decelerate, the positive momentum of Monday could extend through the week and see the Nasdaq make a move for the July high. In that case, bulls could seek to enter dips within Monday's range, with an upside target of the July high.
Another approach is to step aside and wait until CPI data is released. If it does burn hotter than estimates, it could weigh on risk appetite and see the Nasdaq form a swing high beneath the July high. And that could be appealing to bearish swing traders who are seeking momentum in the same direction as its seasonal tendency in September.
-- Written by Matt Simpson
Follow Matt on Twitter @cLeverEdge
How to trade with City Index
You can trade with City Index by following these four easy steps:
-
Open an account, or log in if you’re already a customer
• Open an account in the UK
• Open an account in Australia
• Open an account in Singapore
- Search for the market you want to trade in our award-winning platform
- Choose your position and size, and your stop and limit levels
- Place the trade
Latest market news
Today 10:46 AM
Today 05:56 AM
Yesterday 11:57 PM
Yesterday 08:00 PM
Latest Trade Ideas articles

Today 05:56 AM

Yesterday 11:57 PM
April 26, 2024 11:40 AM

April 25, 2024 03:00 PM