


- “Goldilocks” jobs data and incrementally dovish comments from Fed Chairman Jerome Powell have reinvigorated the Nasdaq 100 uptrend.
- The Nasdaq 100 ostensibly digested yesterday’s dip well, potentially setting the stage for a continuation to new all-time highs, but…
- …AAPL’s ongoing underperformance could increasingly weigh on the index, especially if it breaks below support at $168.
After a brief “hiccup” yesterday, the Nasdaq 100’s relentless uptrend appears to be back on track today. At one point yesterday afternoon, the tech-heavy index was on track for its single worst day since late October, prompting some to call for an interim top, but a late rally turned it into merely a “bad” day.
Heading into today’s US session, stocks saw a series of developments that stoked risk appetite. First the ADP Employment report came in at 140K, roughly in-line with expectations. In combination with today’s mostly as-expected JOLTS survey, its clear that the labor market remains in solid shape ahead of Friday’s highly-anticipated NFP report, with potential for exactly the type of “goldilocks” reading that shows ongoing solid-but-not-excessive strength in the labor market.
Meanwhile, Fed Chairman Powell noted that interest rate cuts remain on the table for the Fed, but that he wanted to see “a little bit more data” before having confidence that inflation was well and truly on the way to the central bank’s 2% target. This phrasing has some traders speculating that the Fed could still start cutting interest rates as soon as early May, a slightly more dovish (and therefore stimulative to stocks) outlook than the June target date for rate cuts that many traders had penciled in at the start of the week.

Nasdaq 100 Technical Analysis – NDX Daily Chart
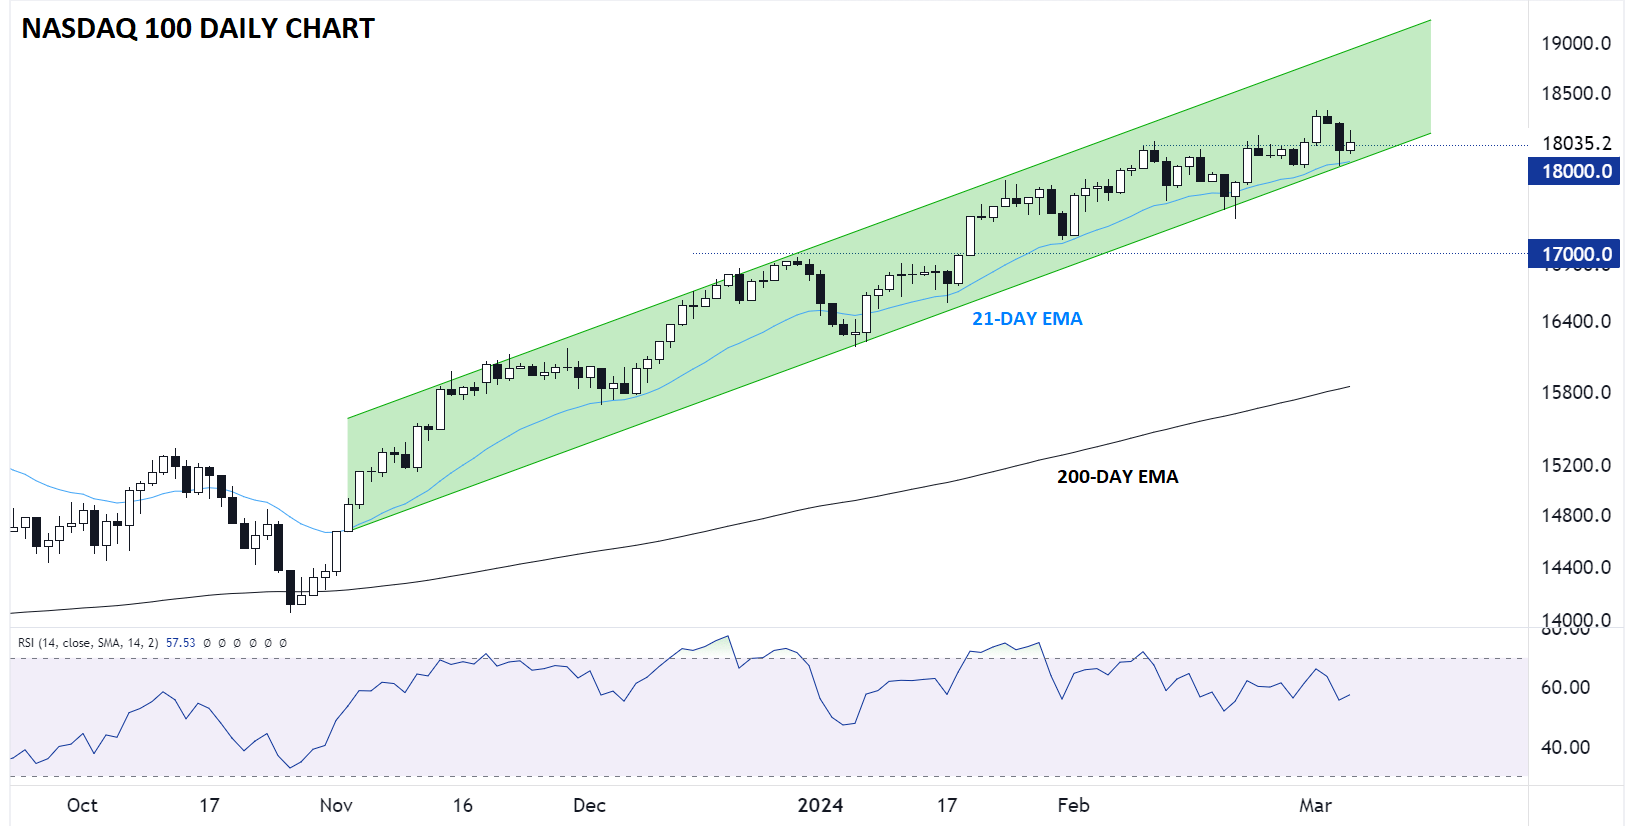
Source: TradingView, StoneX
As the chart above shows, the Nasdaq 100 remains in a healthy uptrend, back above its 21-day EMA and previous-resistance-turned-support at $18K as we go to press. The index appears to have digested yesterday’s dip well, potentially setting the stage for a continuation to new all-time highs as soon as later this week, depending on how macroeconomic data comes in.
However, there is one MAJOR warning flag that Nasdaq 100 bulls should be closely monitoring…
Apple Technical Analysis – AAPL Daily Chart
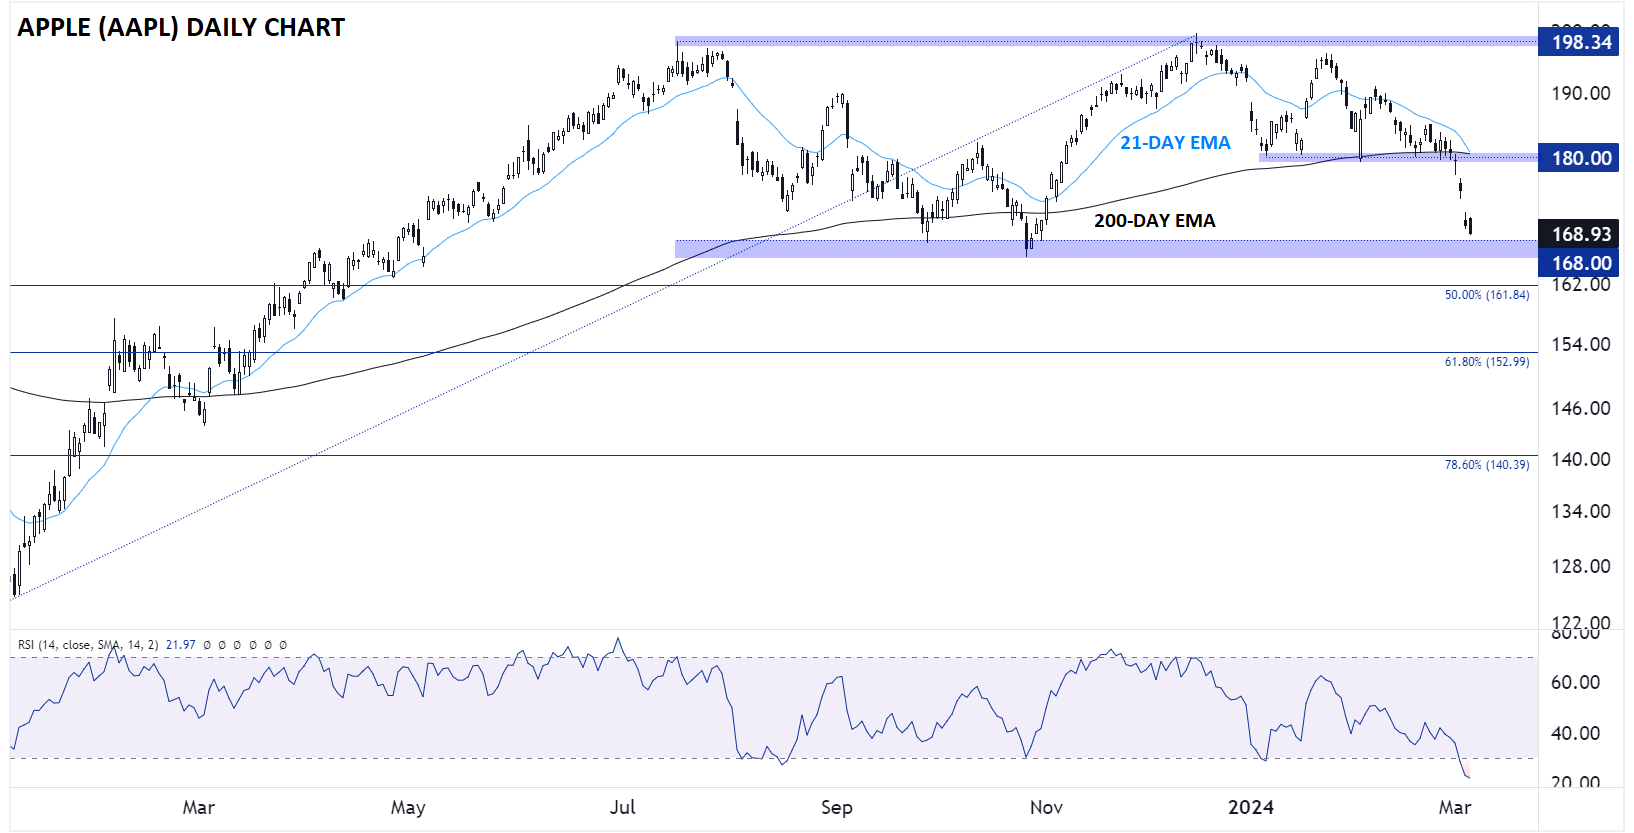
Source: TradingView, StoneX
…and that is the price action in Apple (AAPL), the second-largest stock in the index with a 7.5% weighting.
Apple, long the “Apple of Investors’ Eyes” (pardon the pun), has definitively lost its luster over the last few quarters. The stock is unchanged over the last 10 months and has dropped well below its 200-day EMA for the first time since early 2023.
Taking a step back, AAPL is nearing critical support around the $168 level, which marks the lowest price the stock has traded at since last May. A break below that level would set the stage for a deeper drop toward the Fibonacci retracements of the 2023 rally at $162 (50%) and $153 (61.8%) level next. If we see that scenario develop, it could be enough weigh the other “Magnificent 7” stocks, and the broader Nasdaq 100 as a whole, potentially ending the strong uptrends we’ve seen emerge since late October.
-- Written by Matt Weller, Global Head of Research
Follow Matt on Twitter: @MWellerFX
Latest market news
Yesterday 01:32 PM
Yesterday 09:35 AM
Yesterday 07:23 AM
Yesterday 04:48 AM
Yesterday 12:17 AM
July 25, 2024 10:39 PM
Latest AAPL articles

July 19, 2022 02:42 PM
December 2, 2021 03:03 PM
October 20, 2021 01:34 PM

Yesterday 01:32 PM