


- Gold analysis: Odds of Fed rate cuts have been trimmed, increasing opportunity cost of holding gold over bonds
- Gold likely to hit new records closer to time of rate cuts
- Gold technical analysis point to a neutral outlook for now
Gold analysis video and insights on major FX
Gold was up for the fourth consecutive day when this report was written, up about 0.5% on the session around $2030. The precious metal has found support from a weaker US dollar, which has allowed the EUR/USD to climb above the 1.08 handle, testing the technically-important 200-day moving average at 1.0830.
Gold analysis: Rising opportunity cost
The greenback has failed to find much further support despite last week’s above-forecast inflation prints, as both CPI and PPI beat expectations. Profit-taking could be a factor. Those inflation gauges did cause bond yields to rise but FX markets have largely shrugged the data off. However, with the lack of any significant data or news to cause a big dent in the dollar rally this year, it is difficult to see gold rise much further from current levels. With US 10-year bonds providing yields around 4.25%, gold investors would forgo this by tying up their capital in the metal than in bonds. This represents a sizeable opportunity cost, which does raise question marks about gold’s ability to hold onto its recent gains.
Gold analysis: Odds of Fed rate cuts have been trimmed
According to the CME’s FedWatch tool, which is based on Fed fund futures, the market is currently projecting that the Fed's target range will hold steady at 5.25% - 5.50% for the next two meetings. The likelihood of the first cut occurring in June is a coin flip. Given investors’ insatiable appetite for US tech stocks, it is obvious that many investors probably expect to see a swift adjustment to interest rates, with multiple cuts if US economic data takes a downturn. So far, economic data has proven to be more resilient than expected which means the stock market may have gotten ahead of itself. Unfortunately, there won’t be many significantly important data to concentrate on apart from the global PMI data, scheduled for later in the week.
Gold likely to hit new records closer to time of rate cuts
As we head deeper into the year, inflationary pressures are likely to ease further across the world, potentially leading to the start of the rate-cutting cycle. The likes of the ECB, BoE and Fed are all expected to start the process from around the middle of the year. The actual timing and extent of the rate cuts will depend on incoming data. But as we saw how much of a lift the price of gold obtained from expectations of rate cuts in 2023, we could well see significant gains in 2024 when central banks actually start loosening their polices and yields move lower again. There’s undoubtedly a lot of pent-up demand for gold given how hot inflation has been in recent years. Fiat currencies have lost significant chunks of their values. Gold, which some see as a true store of value, should, in theory, find support even before rates are actually trimmed, as markets tend to price future developments ahead of time. But in the short-term, I am expecting to see further consolidation and a modest pullback.

Gold technical analysis
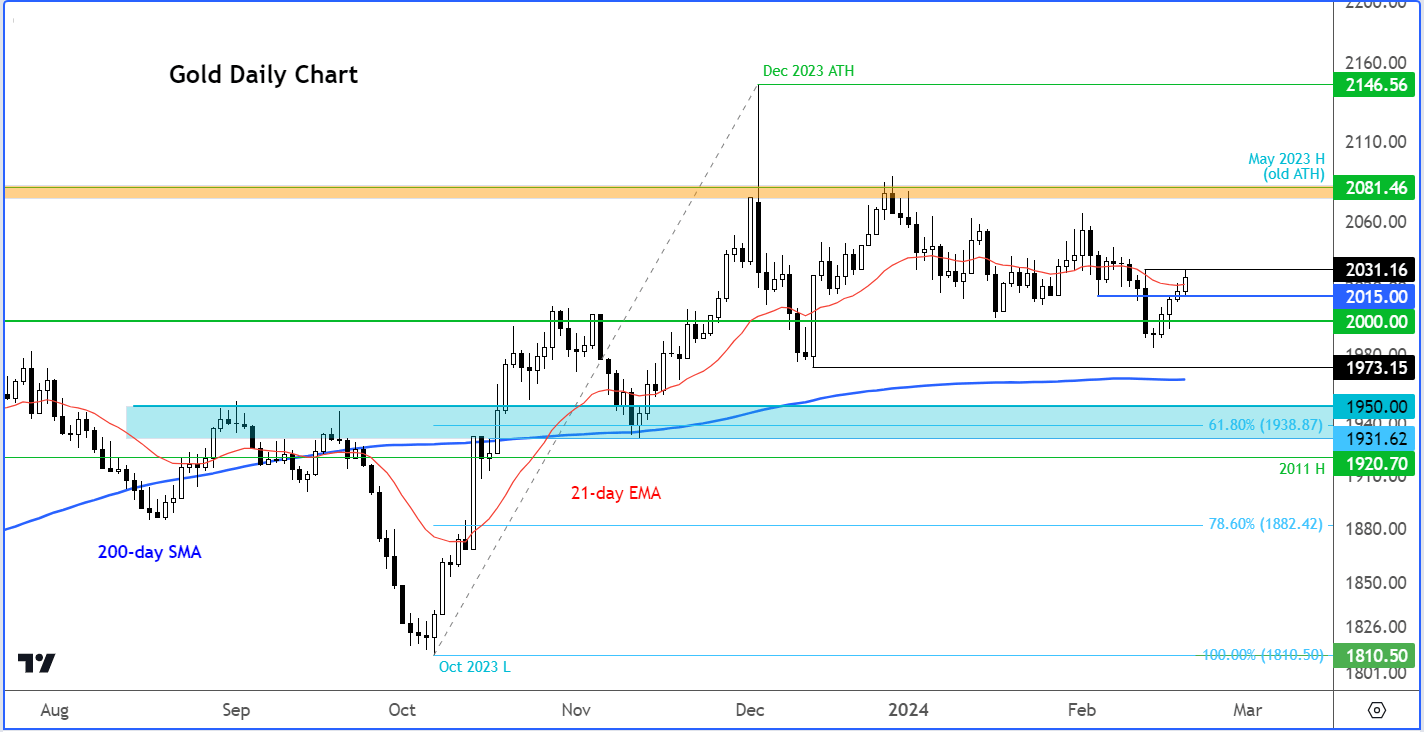
Source: TradingView.com
Gold has made back most of its losses from the previous week but remains bang in the middle of a trading range the metal has been stuck at since hitting a record high in December. For now, gold chart has broken the first line of resistance at $2015, which is a potentially bullish signal. But we will still need to see further bullish price action before dropping our short-term bias on gold. Indeed, should gold go back below $2015, then this could be the signal that many bearish traders are waiting for.
The next level of potential resistance was being tested around $1930 at the time of writing. A clean break above this level could potentially lead to a move towards $2075 to $2080 zone, where gold has never broken above on a weekly closing basis.
On the downside, the support levels to watch below $2015 include the psychologically important $2,000 mark, followed by the December low at $1973, and then the 200-day average coming in a few dollars below it.
-- Written by Fawad Razaqzada, Market Analyst
Follow Fawad on Twitter @Trader_F_R
How to trade with City Index
You can trade with City Index by following these four easy steps:
-
Open an account, or log in if you’re already a customer
• Open an account in the UK
• Open an account in Australia
• Open an account in Singapore
- Search for the company you want to trade in our award-winning platform
- Choose your position and size, and your stop and limit levels
- Place the trade
Latest market news
Yesterday 01:32 PM
Yesterday 09:35 AM
Yesterday 07:23 AM
Yesterday 04:48 AM
Yesterday 12:17 AM
July 25, 2024 10:39 PM
Latest Gold articles

Yesterday 09:35 AM

July 25, 2024 05:30 AM
July 23, 2024 05:20 PM
July 23, 2024 03:17 AM