


What is the FTSE?
The FTSE, or Financial Times Stock Exchange, is the firm that manages a range of indices made up of companies on the London Stock Exchange (LSE). FTSE the company is a subsidiary of the London Stock Exchange Group and manages several indices including the FTSE 100, FTSE 250, FTSE 350, FTSE SmallCap and FTSE All-Share.
The FTSE may also be used in reference to the FTSE 100, an index of the 100 largest companies by market capitalization on the LSE. The largest companies on the FTSE 100 are those in the banking, mining, and energy sectors.
The FTSE 250 is comprised of the next 250 largest companies after the first 100. It is thought to be more representative of the UK economy as it has a smaller percentage of international companies compared to the FTSE 100. Despite including companies with smaller market caps, the FTSE 250 price level has grown significantly larger than the 100 since the FTSE’s inception.
The FTSE 350 is a combination of both the FTSE 100 and 250, the SmallCap indices includes companies ranking 351st to 619th by market cap, and the All-Share is a combination of the top 619 companies on the LSE. There are additional companies listed on the LSE, but these are too small to be considered economic indicators and thus are not included in the SmallCap or All-Share indices.
How to trade the FTSE 100
The FTSE 100 is available to trade with City Index under the name UK 100, alongside dozens of leading indices. Browse our list of indices by theme or sector or read our in-depth guide to trading the FTSE. When you’re ready, follow these steps to start trading:
- Log in to your City Index account, or open an account if you’re not yet a client
- Search for the index you want to trade, in this case the UK 100, on our award-winning platform
- Decide to go long or short with CFDs
- Choose your position and size, and your stop and limit levels
- Place the trade
Not ready to trade live markets? Practice trading with a live City Index demo account.
History of the FTSE
The FTSE 100 was first launched on 3rd January 1984 with a base level of 1,000 points, and quickly became the most followed benchmark for the UK stock market. As time went on and other indices were created, the link between the FTSE 100 and UK economy weakened. Many of its constituents are global companies more impacted by world-wide economic conditions than UK-specific events.
However, this has given the FTSE a close relationship to the pound sterling. When the pound weakens, the FTSE 100 often rises because more international consumers are interested in cheapening UK exports.
This is just one example of how the FTSE 100 might react to economic conditions. Browse the timeline below to learn the history of the FTSE 100, watch the market grow over time, and learn how it reacted to notable events in the past.
1962: the FT All-Shares is launched
While managed today by the Financial Times Stock Exchange, the first FTSE index was launched by the Financial Times. This was not the FTSE 100, but the FT Actuaries All-Shares which included roughly 600 of the largest companies listed on the LSE.
1984: the FTSE 100 is launched
In 1984 the FTSE 100 was launched as a combination between the Financial Times and the London Stock Exchange with a base level of 1,000 points.
1992: additional indices are created
The FTSE 100 quickly became a popular indicator for the UK stock market. Its popularity led to the creation of additional indices in October 1992 such as the FTSE 250 and FTSE 350.
1995: the FTSE Group is formed
Now a subsidiary of Pearson publishing, the Financial Times formed the FTSE Group in partnership with the London Stock Exchange to oversee all FTSE indices. Pearson would later sell its stock in FT in 2011, giving sole ownership to the LSE.
1997-99: the FTSE peaks above 5,000 points
The FTSE indices grew rapidly in the 90s, and by August 1997 the FTSE 100 surpassed 5,000 points. The FTSE 250 followed soon after in February 1998. This rise was mainly driven by huge growth in telecommunications, media and technology companies.
By December 1999 the FTSE 100 reached 6,930.2 – a high it would not touch again for 15 years. The dotcom bubble burst in early 2000, causing both the FTSE 100 and 250 to plummet below 4,000 by the spring of 2003.
2007: the FTSE 250 outpaces the FTSE 100
The FTSE 250 recovered much quicker from the dotcom crash than the FTSE 100. By May 2007 the former was trading above 12,000, and it surpassed 15,000 by October 2013. The FTSE 100, meanwhile, was trading at half of that value in 2013.
The reasons for this divergence come from the difference in global and regional companies listed on the indices. International banks and global commodities companies account for a large share of the FTSE 100, causing the index to feel more pressure amid economic recessions and declines in commodity prices.
2008: the Global Financial Crash
A major meteor to the FTSE value was the 2008 financial crash. The FTSE 100 fell 31% in 2008 after the bank Lehman Brothers filed for bankruptcy. Then, insurer AIG reported the largest quarterly loss in US corporate history in 2009. Despite this happening on US soil, the UK – and many other nations – entered recessions.
While the FTSE 250 fell at a similar rate to the large-cap index, it recovered quicker thanks to its composition of mid-cap, UK-focused companies. Additionally, banks were hit the hardest and accounted for 12.67% of the FTSE 100 at the time. Meanwhile the sector only made up 0.36% of the FTSE 250.
2016: Brexit’s effect on the FTSE
The vote for Brexit on 23 June 2016 negatively impacted UK stocks at first – and many analysts predicted regional companies on the FTSE 250 would be hit worse than the more global FTSE 100. However, the pound also declined in value following Brexit, which gave both indices a boost once the economy settled down. Both indices went on to hit record highs later that year.
2021: the FTSE 250 peaks above 24,000
The FTSE 250 hit its highest level to date on 7 September 2021 at 24,354. This came after achieving its highest annual return of the past decade in 2019 at 28.9%. The index dipped only slightly the year after during the onset of the Covid pandemic before growing another 16.9% in 2021.
2023: the FTSE 100 reaches 8,000
While the FTSE 250 has continued to outpace the FTSE 100 by leaps and bounds, the larger index has also reached new highs recently. On 20th February 2023 it reached 8,014. Similar to the boost experienced post-Brexit, analysts attribute this record high to a depreciation of the pound in relation to other dominant currencies.
FTSE today
The FTSE 100 might not be as domestically focused as the 250, but it is still viewed as the benchmark index for UK stock market performance. Despite hitting new heights in 2023, the future for the index remains unclear, with the post-Brexit trade picture still uncertain and numerous headwinds for the UK economy.
The index has seen a lot of volatility in its 40-year history so far. Few would bet against a lot more in the years to come.
You can read up-to-date reports on the current state of the FTSE 100 and outlooks on where it is headed in the future from our team of market analysts.
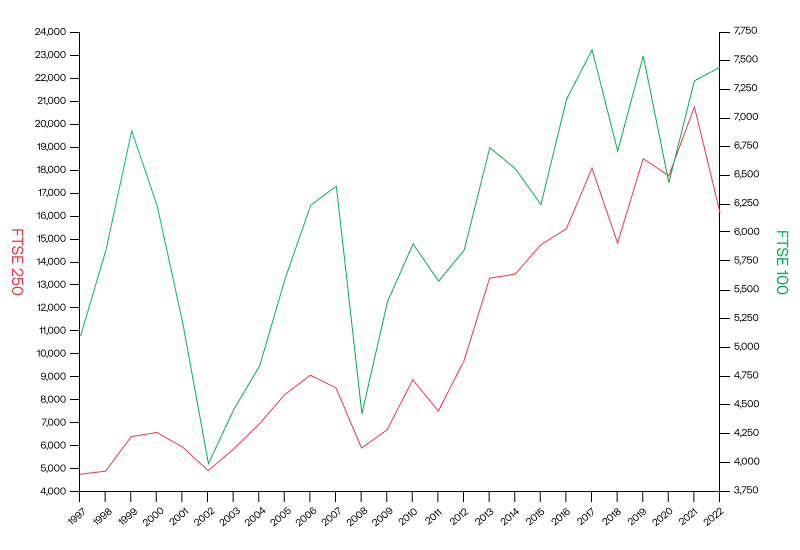
Yearly closing price of FTSE 100 and FTSE 250
We’ve graphed the yearly chart history of the FTSE 100 and FTSE 250 below. Take note of dips and recoveries following the dot-com crash, great recession and Brexit. You can also see how the FTSE 250 has outstripped the FTSE 100 by leaps and bounds beginning in the 21st century.
Which companies have been on the FTSE the longest?
Of the 100 companies first listed on the FTSE 100 in 1984, only 18 of them have remained on the index since its inception. About a dozen more have fallen of the index and later re-joined it. The most recent founding company to be removed from the FTSE 100 is Marks & Spencer after its share price slumped to a near 20-year low in the fall of 2019. The home goods and clothing retailer shuttered 120 locations around the same time, significantly withdrawing their presence across the UK.
|
British American Tobacco (BATS) |
Tobacco producer |
Reckitt Benckiser (RKT) |
Consumer goods |
|
Barclays (BARC) |
Financial services |
RELX Group (REL) |
I.T. |
|
British Petroleum (BP.) |
Oil producer |
Rio Tinto (RIO) |
Mining |
|
Glaxo Holdings (GSK) |
Pharmaceuticals |
NatWest (NWG) |
Financial services |
|
Land Securities (LAND) |
Real estate |
Sainsbury’s (SBRY) |
Consumer goods |
|
Legal & General (LGEN) |
Insurance |
Shell Plc. (SHEL) |
Oil producer |
|
Lloyds Banking Group (LLOY) |
Financial services |
Smith & Nephew (SN.) |
Manufacturing |
|
Pearsons & Son (PSON) |
Publisher |
Tesco (TSCO) |
Consumer goods |
|
Prudential Corp. (PRU) |
Insurance |
Unilever (ULVR) |
Consumer goods |
Latest market news
Yesterday 01:32 PM
Yesterday 09:35 AM
Yesterday 07:23 AM
Yesterday 04:48 AM
Yesterday 12:17 AM
July 25, 2024 10:39 PM
Latest UK 100 articles

July 4, 2024 11:00 AM

June 19, 2024 12:00 PM
March 21, 2024 04:00 PM
March 11, 2024 04:30 PM