


Bitcoin and Ethereum takeaways
- Bitcoin and Ethereum have not shown a strong correlation with the Nasdaq 100 or gold this month.
- Bitcoin continues to consolidate around $27K, but remains within a longer-term bullish trend for now.
- Ethereum is showing signs of a bullish breakout today, potentially opening a door for a move up to $2,000 next.
Bitcoin and Ethereum fundamental analysis
Ever since cryptoassets like Bitcoin and Ethereum have been widely investable, investors have debated where the asset class should sit in a portfolio.
Are they most similar to “store of value” commodity like gold?
Or are they more akin to volatile risk assets such as the Nasdaq 100?
The cynics would even argue that they’re merely a bubble that will inevitably disappear, though that argument becomes less and less compelling every day as Bitcoin approaches the 15th anniversary of its “Genesis Block” on January 3rd 2009.
Even over nearly a decade and a half, the answer remains elusive. Take the price action over the course of this month as an example: Gold has struggled amidst strength in the US dollar, whereas the Nasdaq 100 has surged after a strong earnings season…while Bitcoin and Ethereum remain essentially unchanged:
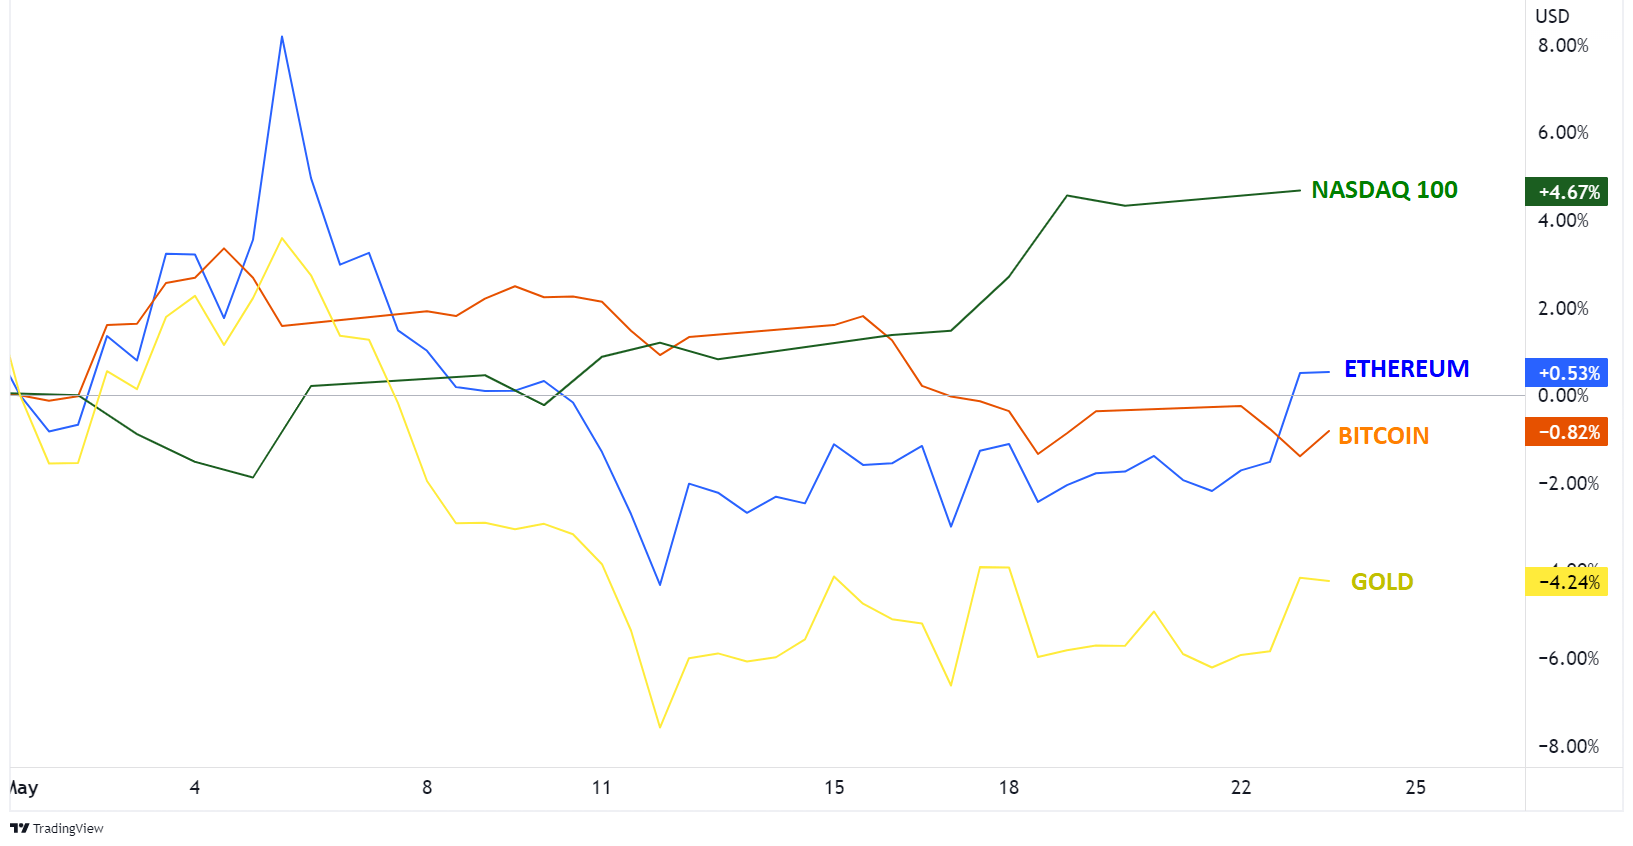
Source: Tradingview, StoneX
To put some numbers on this, Bitcoin’s 30-day correlation with the Nasdaq 100 has fallen to -0.61, its lowest level since late 2022 (and June 2021 before that), and the equivalent correlation coefficient with gold sits at 0.30, near a two-month low.
Looking ahead, simmering financial issues like the US debt ceiling debate and global banking sector stresses could boost cryptoassets if they boil over in the days and weeks to come, but for now, interest and volatility in the cryptosphere remains subdued.
Bitcoin technical analysis – BTC/USD daily chart
Looking at Bitcoin’s chart, traders are waiting for a definitive break away from the $27K level that has magnetically pulled prices back consistently for the past two weeks. The cryptocurrency is still holding above its rising 100- and 200-day EMAs, suggesting the longer-term trend remains in favor of the bulls for now, so as long as support in the lower-$26K range holds, swing traders may maintain a bullish bias.
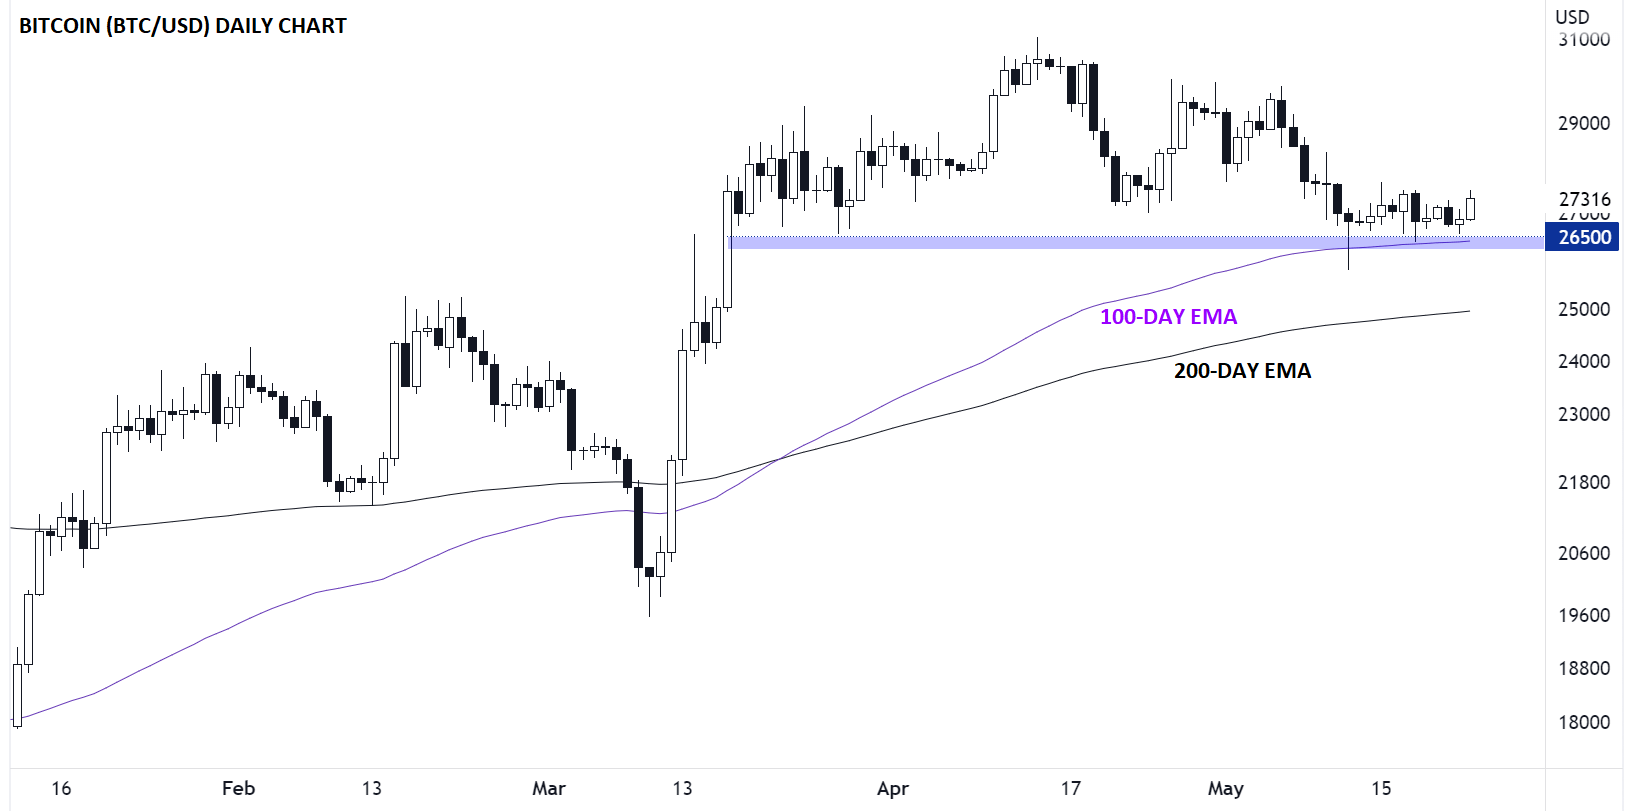
Source: Tradingview, StoneX. Please note this market may not be available in your region.
A break below that support zone would confirm a modified head-and-shoulders pattern and point to a deeper retracement toward the 200-day EMA near $25K at a minimum.
Ethereum technical analysis – ETH/USD daily chart
Ethereum’s chart looks similar to its bigger brother, though today’s price action hints at a potential breakout from the recent consolidation range. For ETH/USD, a daily close near current levels would open the door for a continuation toward the monthly highs near $2000, followed by the 1-year highs up around $2100 next. Only a reversal back below the 100-day EMA near 1775 would erase the near-term bullish bias.
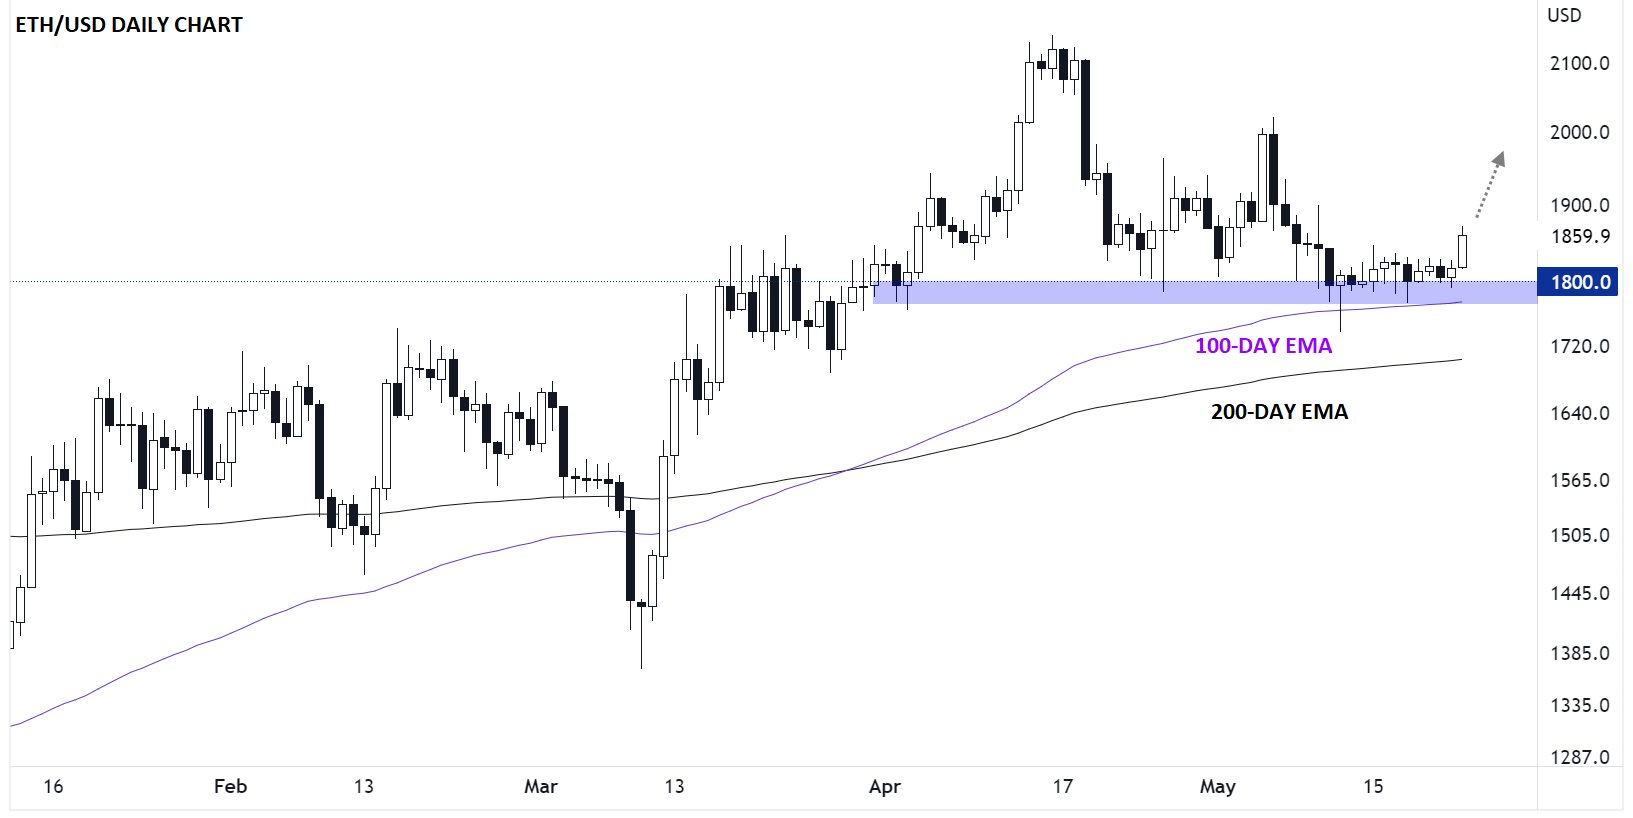
Source: Tradingview, StoneX. Please note this market may not be available in your region.
-- Written by Matt Weller, Global Head of Research
Follow Matt on Twitter: @MWellerFX
Latest market news
Yesterday 01:32 PM
Yesterday 09:35 AM
Yesterday 07:23 AM
Yesterday 04:48 AM
Yesterday 12:17 AM
July 25, 2024 10:39 PM
Latest Ethereum articles

May 23, 2024 01:49 PM

March 12, 2024 11:00 AM

September 29, 2023 02:58 PM

April 19, 2023 03:30 PM