


- Gold analysis: US dollar bounces back as yields rise on firmer US data
- Opportunity cost of holding gold rises with yields climbing and amid a racier US equity market
- Gold technical analysis suggests a potential break below $2015 could initiate renewed selling pressure
Gold turned lower after a positive start. The US dollar recovered from earlier weakness and bond markets sold off, pushing their yields higher. The US 10-year yield reached its highest level since November, at 4.35%. Gold investors would forgo this by tying up their capital in the metal than in bonds. Investors have also been enjoying remarkable gains in technology stocks, with Nvidia surging some 15% today to potentially record the biggest single-day market cap gain on Wall Street history. Rising yields and rallying equity markets represents a sizeable opportunity cost investors would forgo by investing in gold. Gold doesn’t pay interest or dividends, and costs money to store. While I continue to think the precious metal will hit fresh records possibly later in the year when central banks start cutting rates, the short-term outlook remains bearish given the factors just mentioned.
Video: Gold analysis and insights on FX majors and indices
Gold analysis: US dollar bounces back as yields rise on firmer US data
The US dollar was weaker earlier, after failing to rise despite last week’s above-forecast inflation prints, as both CPI and PPI beat expectations. Profit-taking may well have been a factor behind the dollar’s weakness earlier in the week, while investor also found some foreign currencies attractive in light of the big risk rally.
But with US data remaining mostly positive, with existing homes sales, manufacturing PMI and jobless claims all topping expectations today, the dollar bears are finding it difficult to justify being overly bearish on the dollar for now.
Due to the absence of weak data or noteworthy news that could significantly impact the dollar's surge this year, it becomes challenging to envision gold climbing substantially beyond its current levels. With yields on the rise, investors in gold would be foregoing this potential return by investing in the metal instead of bonds. A notable opportunity cost. So, I am doubtful about gold's ability to maintain its recent advance.
Gold’s longer-term outlook still positive
As we move through the year, it's likely that inflation pressures will ease up globally, possibly kicking off a round of interest rate cuts. The ECB, BoE, and Fed are expected to start this process around mid-year, depending on how the data unfolds. Looking back at how gold prices shot up in anticipation of rate cuts in 2023, we could see some big gains in 2024 once central banks actually start easing up and yields drop again. But that could be months away, which gives gold bears plenty of time to potentially slam it down.
There's undoubtedly demand for gold, partly because inflation has been sticking around and fiat currencies have been losing value. Gold, often seen as a safe haven asset and a hedge against inflation, might get a boost even before the rate cuts actually happen, as markets tend to predict future moves. But in the short term, it's likely we'll see some more settling down and maybe a slight dip.

Gold technical analysis
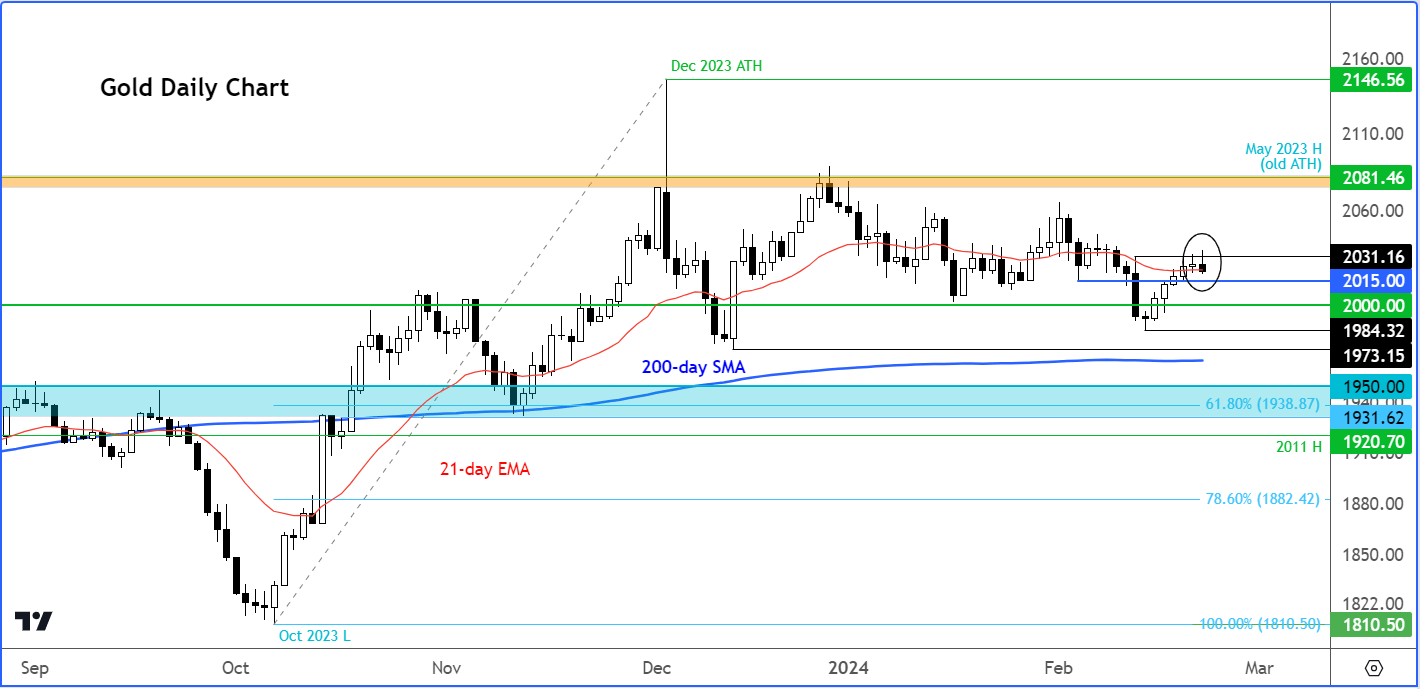
Source: TradingView.com
The daily gold chart above shows the metal remains firmly within a trading range it has been confined to since reaching a record high in December. Recently, gold surpassed the initial resistance line that I was previously monitoring at $2015, a level now crucial for bears to reclaim control of. A drop below $2015 could serve as a bearish signal for traders.
Below $2015, key support levels to monitor include the psychologically significant $2,000 mark, followed by the December low at $1973, and then the 200-day moving average just below it.
On the upside, the next potential resistance level, which remained unbroken today, sits around $1930/35. A decisive breakthrough above this area might pave the way for a move towards the $2075 to $2080 zone, where gold has yet to close above on a weekly basis.
-- Written by Fawad Razaqzada, Market Analyst
Follow Fawad on Twitter @Trader_F_R
How to trade with City Index
You can trade with City Index by following these four easy steps:
-
Open an account, or log in if you’re already a customer
• Open an account in the UK
• Open an account in Australia
• Open an account in Singapore
- Search for the company you want to trade in our award-winning platform
- Choose your position and size, and your stop and limit levels
- Place the trade
Latest market news
Yesterday 01:32 PM
Yesterday 09:35 AM
Yesterday 07:23 AM
Yesterday 04:48 AM
Yesterday 12:17 AM
July 25, 2024 10:39 PM
Latest Gold articles

Yesterday 09:35 AM

July 25, 2024 05:30 AM
July 23, 2024 05:20 PM
July 23, 2024 03:17 AM