


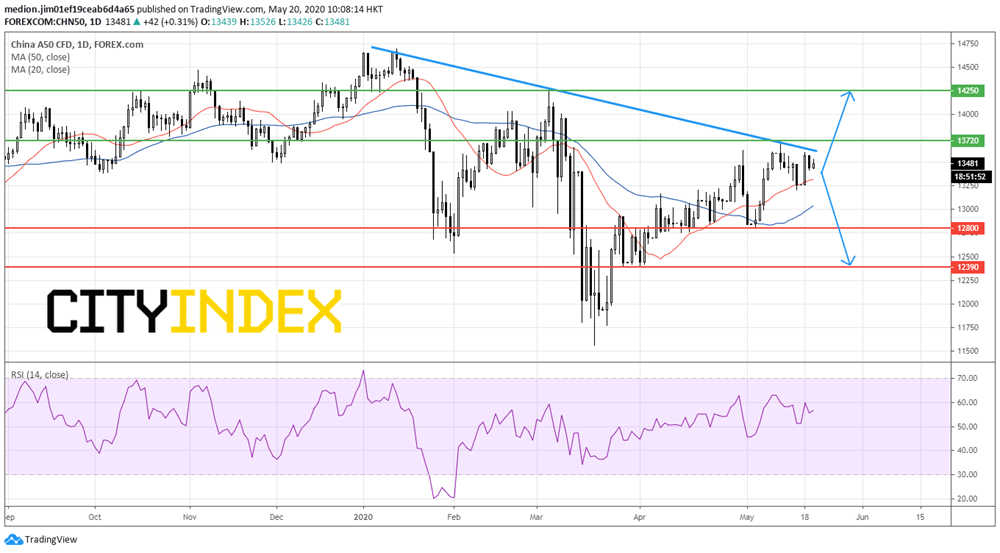
A50 Index (Short term): Focus on the Declining Trend Line
The A50 Index has rebounded around 13% from the March on the hope of economic recovery after the COVID-19 outbreak.
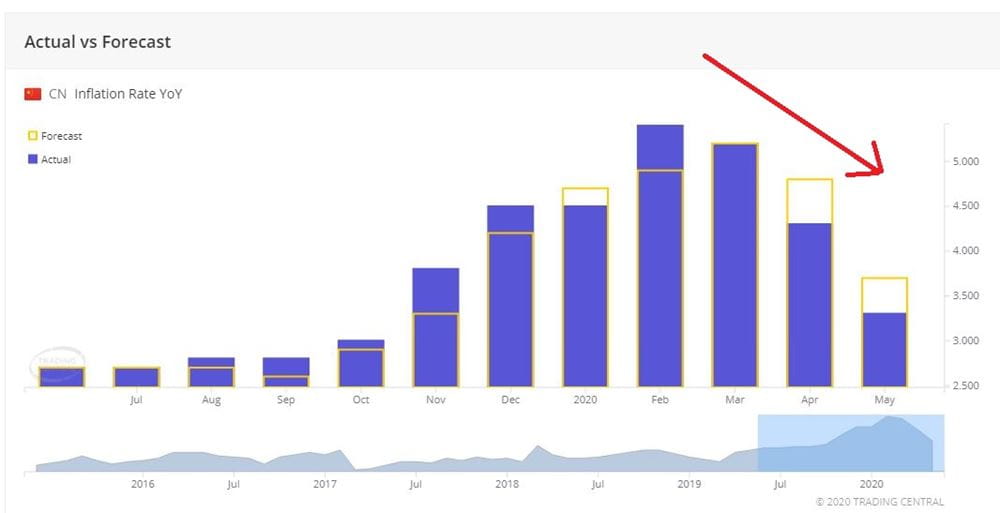
Last week, China's CPI grew 3.3% on year in April, worse than the expectation of the increase of 3.7%, compared with the growth of4.3% in March, according to the government. In the below chart, the growth of CPI is slower since February, but has not reversed up.
Source: Trading Economic
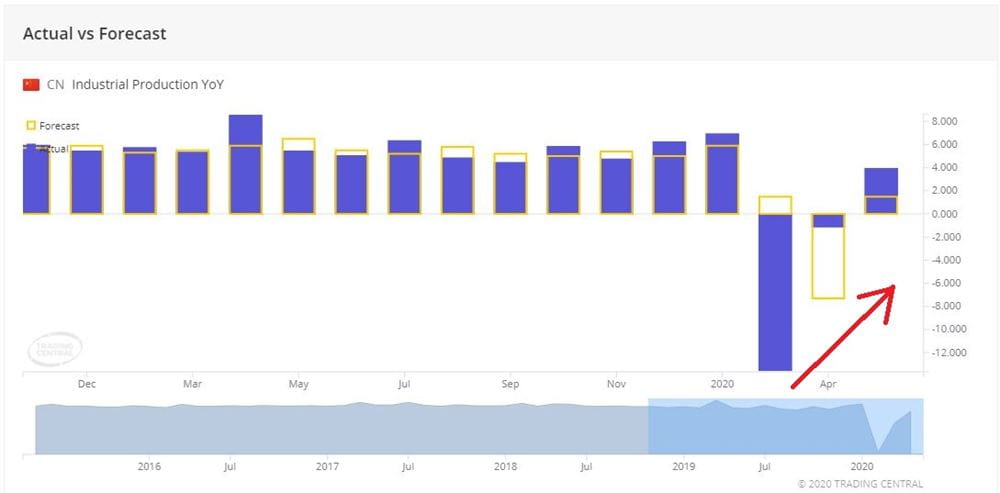
On the other hand, China's industrial production rose 3.9% on year in April, better than the expectation of an increase of +1.5%. In the below chart, the industrial production data has reversed up since March and returned to the positive in recent data. It indicates that the industrial activities are recovering in China.
Source: Trading Economic
On a daily chart, the index prices remain capped by a declining trend line drawn from January top, indicating a bearish outlook. However, the index stays above both rising 20-day and 50-days moving averages, which suggests a positive bias. As the technical views are mixed, it is better to stay at neutral bias.
On the upside, only a break above 13720 (the high of May 11) would validate a bullish breakout of declining trend line and call for a rise to the resistance level at 14250 (the high of March).
On the downside, a break below the previous low at 12800 would violate the higher tops and higher bottoms pattern and bring a return to 12390 (the low of April).
Source: GainCapital, TradingView
Last week, China's CPI grew 3.3% on year in April, worse than the expectation of the increase of 3.7%, compared with the growth of4.3% in March, according to the government. In the below chart, the growth of CPI is slower since February, but has not reversed up.
Source: Trading Economic
On the other hand, China's industrial production rose 3.9% on year in April, better than the expectation of an increase of +1.5%. In the below chart, the industrial production data has reversed up since March and returned to the positive in recent data. It indicates that the industrial activities are recovering in China.
Source: Trading Economic
On a daily chart, the index prices remain capped by a declining trend line drawn from January top, indicating a bearish outlook. However, the index stays above both rising 20-day and 50-days moving averages, which suggests a positive bias. As the technical views are mixed, it is better to stay at neutral bias.
On the upside, only a break above 13720 (the high of May 11) would validate a bullish breakout of declining trend line and call for a rise to the resistance level at 14250 (the high of March).
On the downside, a break below the previous low at 12800 would violate the higher tops and higher bottoms pattern and bring a return to 12390 (the low of April).
Source: GainCapital, TradingView
Latest market news
Yesterday 01:32 PM
Yesterday 09:35 AM
Yesterday 07:23 AM
Yesterday 04:48 AM
Yesterday 12:17 AM
July 25, 2024 10:39 PM
Latest A50 articles

July 2, 2024 10:45 PM

July 2, 2024 02:00 AM

June 27, 2024 03:39 AM

June 19, 2024 11:37 PM