USD CAD A potential bull haven from market turmoil
Depending on your trading style, you either can’t wait to hear the closing bell at the end of today’s US session or you’ll be extremely […]
Depending on your trading style, you either can’t wait to hear the closing bell at the end of today’s US session or you’ll be extremely […]
Depending on your trading style, you either can’t wait to hear the closing bell at the end of today’s US session or you’ll be extremely sorry to see this week come to an end. Either way, there’s still a full trading session today, as well as another two and a half weeks, before the Federal Reserve’s highly-anticipated September monetary policy meeting. Market volatility is likely here to stay until (at least) that event and likely beyond, so it makes sense to see which strong trends managed to weather this week’s jumpy markets.
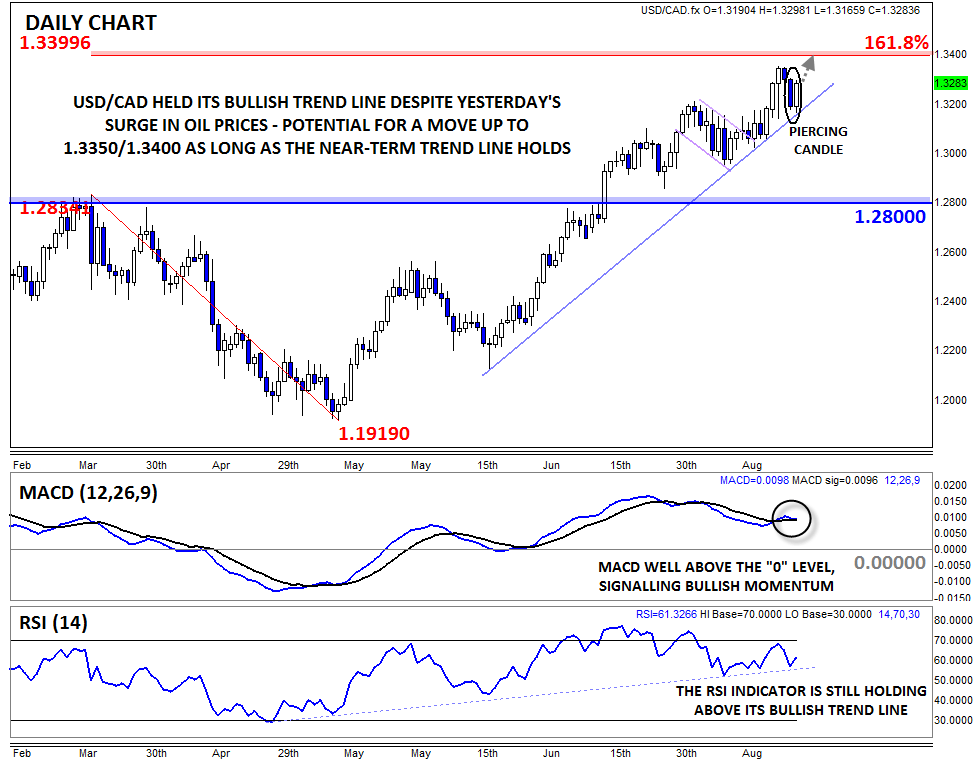
One of the clearest trends in G10 FX right now is in USD/CAD, which continues to find support at the bullish trend line off its mid-June low. The pair’s strength is all the more impressive considering yesterday’s massive rally in oil prices. West Texas Intermediate (WTI) oil rocketed nearly 10% yesterday, the biggest move for so-called “black gold” since 2009. As we’ve noted before, Canada is the world’s sixth largest oil producer and the largest single exporter of oil to the United States, so the commodity’s price (usually) has a clear influence on the Canadian dollar.
While the loonie did strengthen somewhat yesterday, the gains were relatively limited in scope, with USD/CAD “only” edging down by about 125 pips back to its bullish trend line. Now, rates are seeing a strong recovery, creating a potential Piercing Candle* on the daily chart. This candlestick pattern indicates a shift from selling to buying pressure and raises the probability of a near-term low forming. Simultaneously, the secondary indicators are also constructive, with the MACD solidly above the “0” level and the RSI holding its recent bullish trend line.
As it currently stands, the USD/CAD uptrend remains healthy and may provide a haven for traders seeking shelter from ongoing market turmoil. To the topside, the key levels to watch will be this week’s 11-year high at 1.3350, followed by the 161.8% Fibonacci extension of the Q2 pullback at 1.3400. Alternatively, a break below the bullish trend line at 1.3175 would shift the near-term bias back to neutral as traders go looking for another trend.
*A Piercing Candle is formed when a candle trades below the previous candle’s low, but buyers step in and push rates up to close in the upper half of the previous candle’s range. It suggests a potential bullish trend reversal.
 Source: City Index