
- S&P 500 analysis: Stocks drop as yields continue upsurge
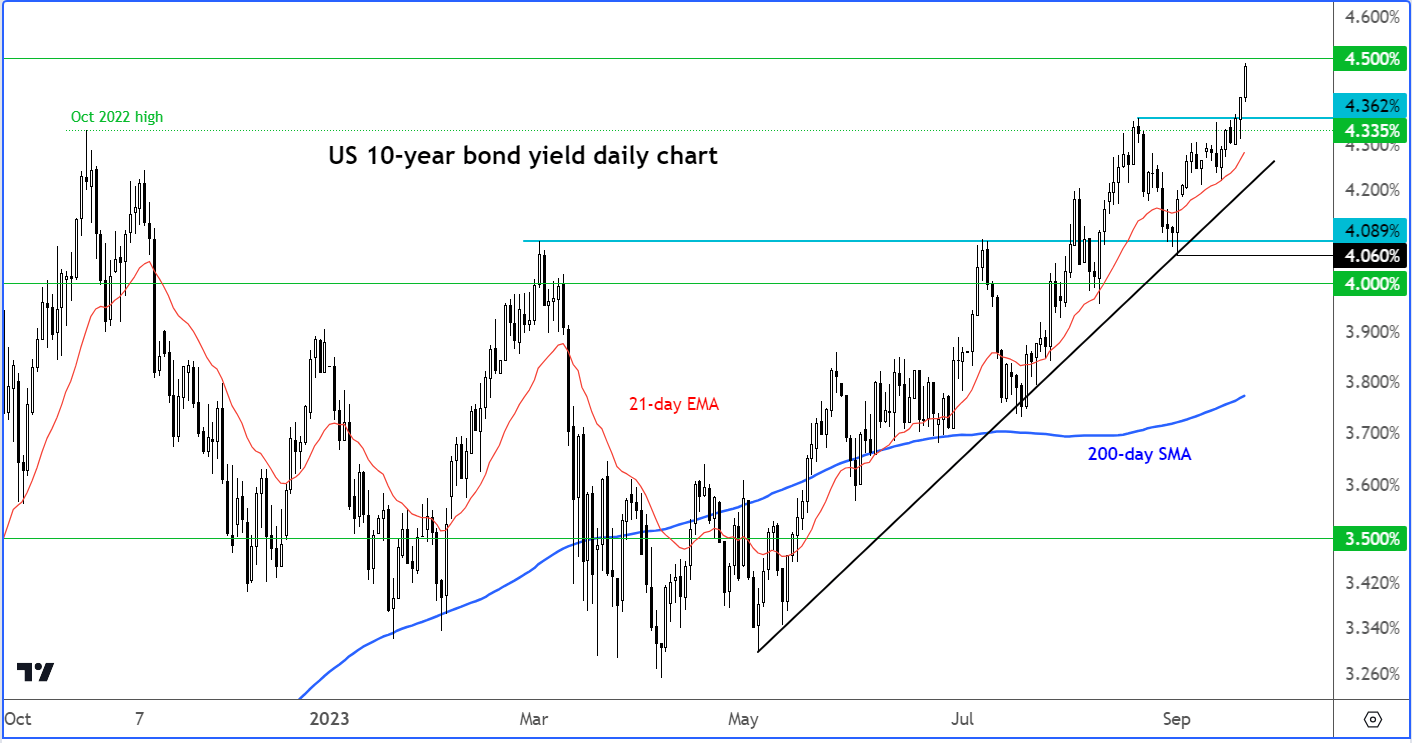
- US 10-year yields near 4.500%
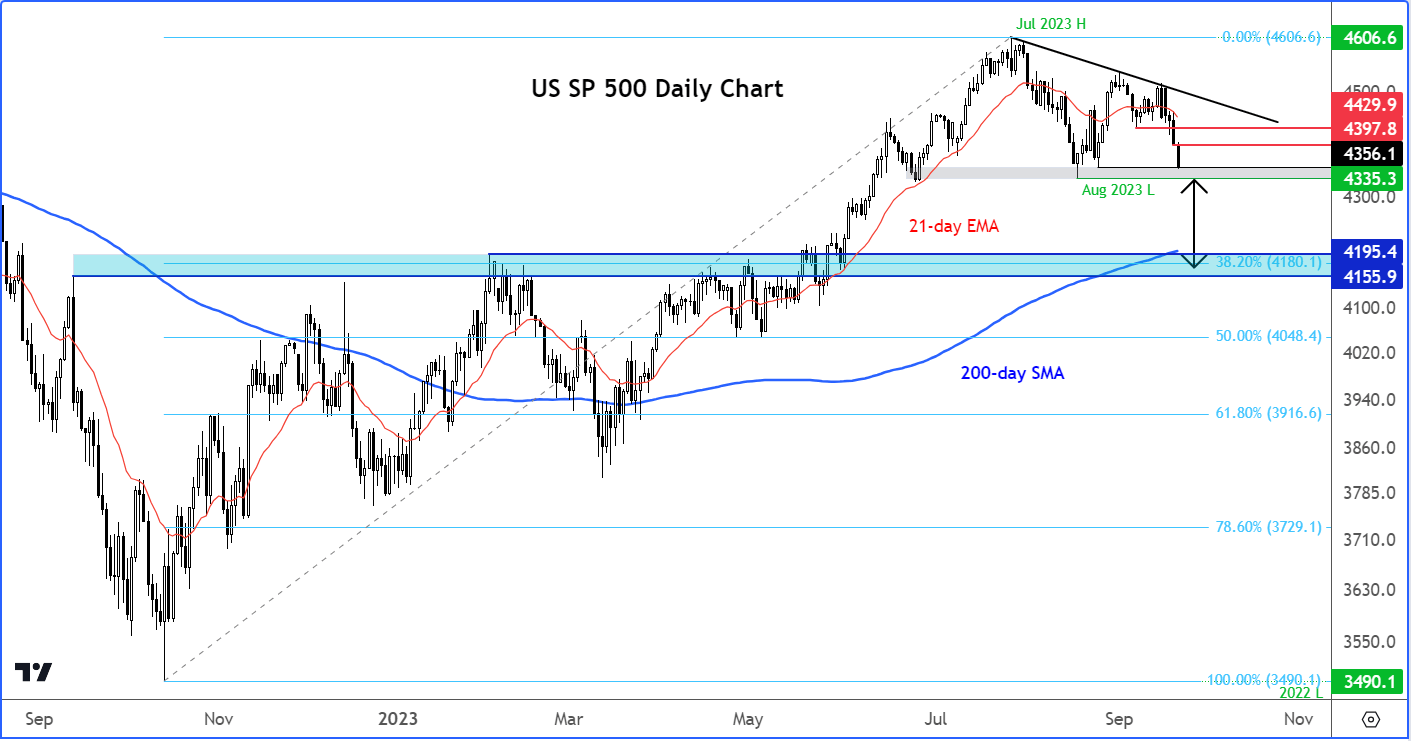
- S&P 500 technical analysis point further lower
US stocks sold off sharply ever since the Fed delivered that hawkish interest rate pause on Wednesday. At the time of writing, the major indices were still testing their lows after futures had slid along with global markets, extending losses from the previous session. The market is falling because of fears over the impact of rising bond yields. The sell-off may need to extend further before investors find value in stocks, especially in growth equities.
US 10-year yields near 4.500%
The Fed’s warning that interest rates will remain elevated around current levels for a few quarters, means monetary policy is going to remain contractionary for a long period of time. While it may be needed to bring inflation down, it is clearly bad news for the economy. One also has to wonder about the potential for another credit event being triggered, and its implications for the global economy and stock markets.
Apart from the fact that the Fed is hawkish, and interest rates are obviously quite high, rising bond yields may also reflect investors growing worried about something much bigger, like the ballooning US debt levels. It makes sense for them to demand a higher rate of return for parking their funds in the so-called “risk-free” asset – especially when you consider that the government will need to keep borrowing and paying more and more to service its debt. Issuing more and more debt is clearly not sustainable and at some point, it will have to be addressed.
Anyway, if yields continue to remain elevated, then this could weigh further on longer-duration equities, those that are expected to produce their highest cash flows in the future. Many of such companies are dominated in the technology sector, putting the tech-heavy Nasdaq 100 into focus, but it could also weigh down on the broader S&P 500 index.
S&P 500 analysis: Technical analysis
If more investors become worried about rising yields, which was the main driver behind last year’s stock market sell-off, then there is a lot of room to the downside before markets bottom out.
In fact, come to think about it, yields have already surpassed last year’s peak, while the S&P is only 5% off its recent high hit in July. I am not necessarily suggesting that the S&P will reach last year’s low, but if it did, that would represent another 20% decline from current levels. That would be huge.
But a bigger correction is warranted given the big rise in bond yields and concerns over valuations. In fact, the S&P has not even pulled back to the shallow 38.2% Fibonacci retracement level around 4180 against its rally from last October. So, as a minimum, I would expect a decline to that area in the coming weeks, which would represent a sell-off of around 4% from the current levels. The area around 4180 was also previously resistance and it is where the 200-day average comes into play. So, it is a massive level from a technical standpoint.
To get anywhere near that target, the bears would now like to see a clean break below support in the shaded grey region on the chart, between 4335 and 4356.
-- Written by Fawad Razaqzada, Market Analyst
Follow Fawad on Twitter @Trader_F_R
Source for all charts in this article: TradingView.com
How to trade with City Index
You can trade with City Index by following these four easy steps:
-
Open an account, or log in if you’re already a customer
• Open an account in the UK
• Open an account in Australia
• Open an account in Singapore
- Search for the company you want to trade in our award-winning platform
- Choose your position and size, and your stop and limit levels
- Place the trade
Latest market news
Yesterday 01:32 PM
Yesterday 09:35 AM
Yesterday 07:23 AM
Yesterday 04:48 AM
Yesterday 12:17 AM
July 25, 2024 10:39 PM
Latest US 500 articles

July 25, 2024 01:30 PM

July 18, 2024 11:14 PM

July 18, 2024 11:35 AM

June 13, 2024 02:00 PM